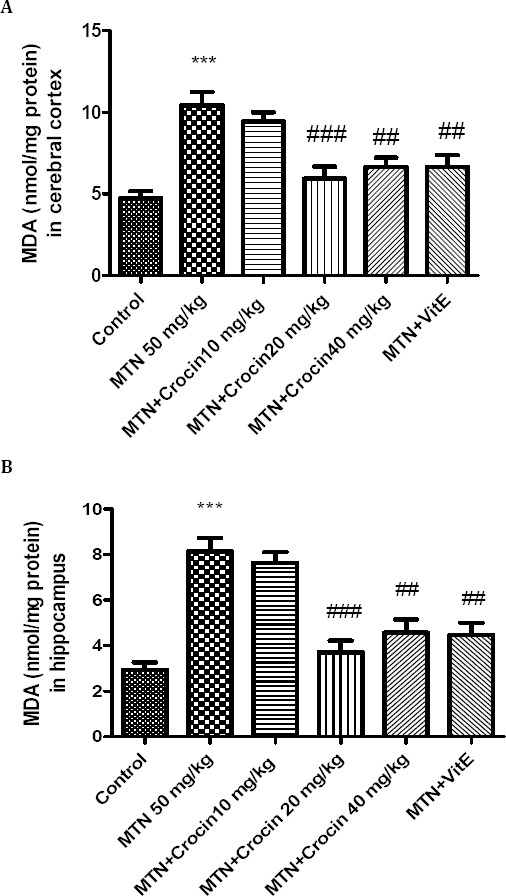
Figure 4.

Effects of malathion (50 mg/kg) and crocin on the level of MDA in rat cerebral cortex (A) and hippocampus (B). Data are presented as mean ± SEM. *** P<0.001 as compared with control (normal saline) group after 14 days, ##P<0.01 and ###P<0.001 as compared with MTN (malathion) group after 14 days
