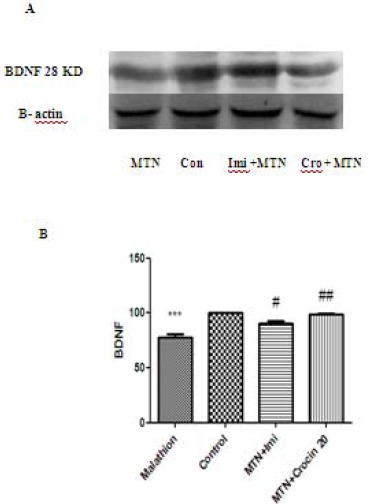
Figure 7.

Effects of malathion (50 mg/kg) and crocin on the BDNF level in the rat hippocampus by western blotting (Con=control, Cro=crocin, IMI=imipramine, MTN=malathion). (A) Representative western blots showing specific bands for BDNF and β-actin as an internal control. These bands are representative of four separate experiments. (B) Densitometric data of protein analysis. Data are expressed as the mean ± SEM. *** P<0.001 as compared with control (normal saline) group, #P<0.05 and ##P<0.01 as compared with MTN (malathion) group
