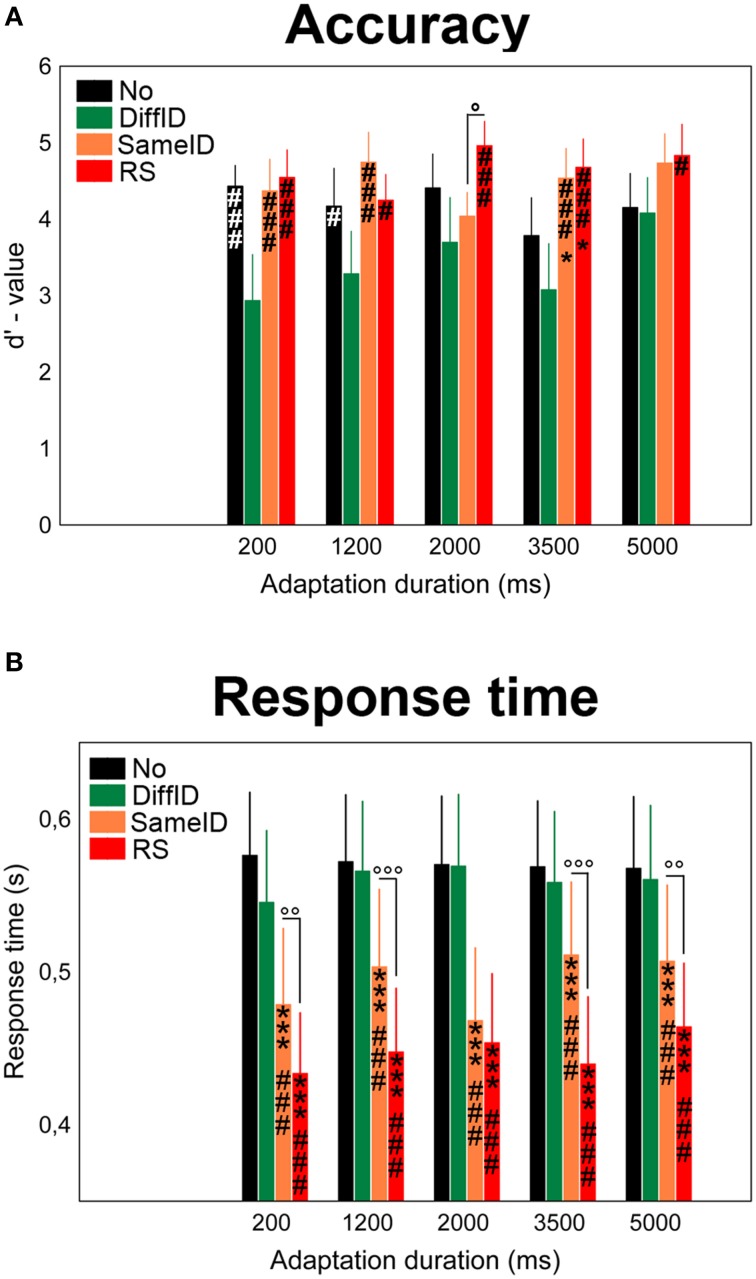
Figure 2.
Behavioral results. Effects of varying adaptation durations on the accuracy (A) and response times (B) in the familiarity decision task. No (black), DiffID (green), SameID (orange), RS (red). “*” shows significant differences when compared with the control (No). “#” shows significant differences when compared with the DiffID condition. “°” shows significant differences between SameID and RS. One symbol indicates p < 0.05, two symbols indicate p < 0.01, and three symbols indicate p < 0.001.

