Figure 4.
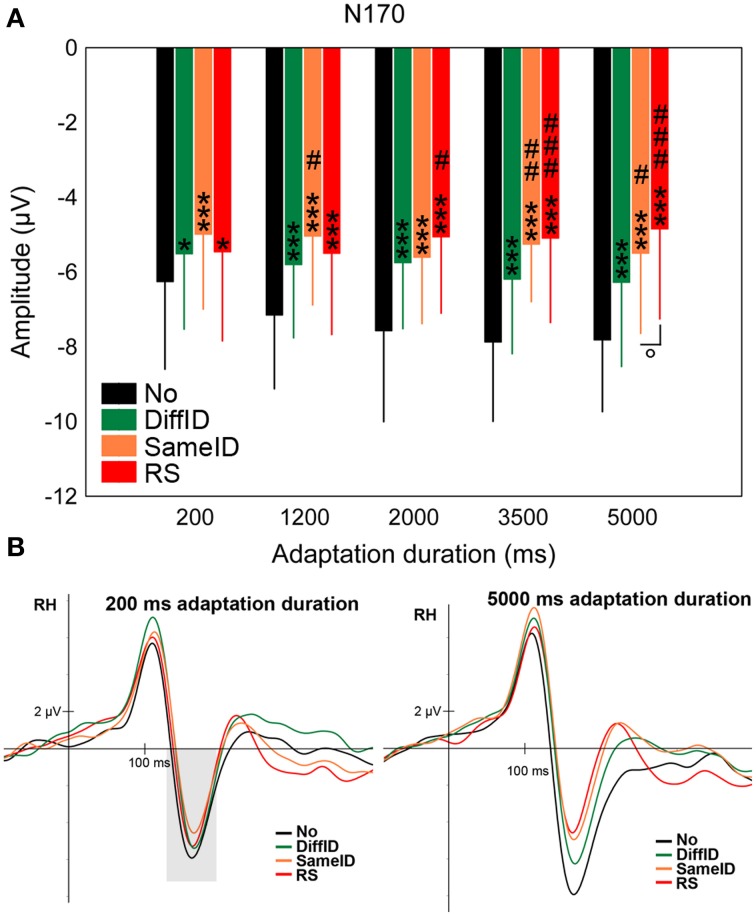
N170. (A) Average (±SE) amplitude values of the N170 component for the five adaptation durations (200, 1200, 2000, 3500, and 5000 ms), No, DiffID, SameID, and RS conditions. “*” shows significant differences when compared with the control (No). “#” shows significant differences when compared with the DiffID condition. “°” shows significant differences between SameID and RS. One symbol indicates p < 0.05, two symbols indicates p < 0.01, and three symbols indicates p < 0.001. (B) Sample grand average ERPs from RH (pooled from P8, P10, and PO10) in No (black), DiffID (green), SameID (orange), and RS (red) conditions after short/rapid (200 ms) adaptation duration (lower left panel) and long (5000 ms) duration (lower right panel). Gray area marks the time-window where the component was analyzed on the respective RH electrode(s).

