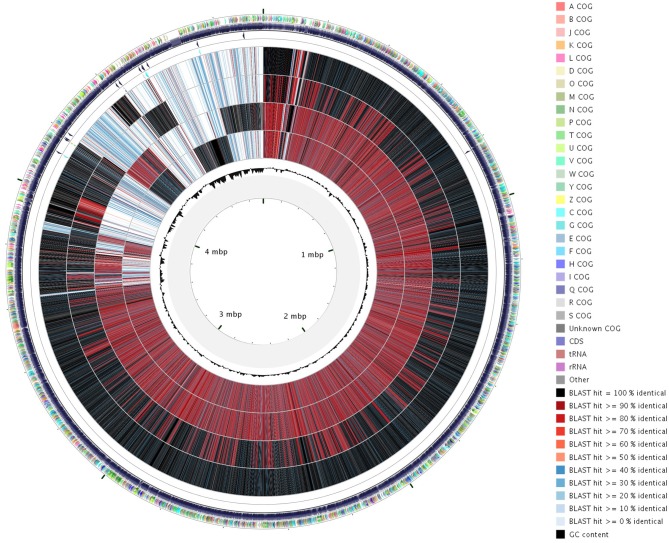
Figure 2.
Circular representation with CGView tool of the orthoMCL analysis of the four X. arboricola genomes. Genomic sequences were compared against each other and BLAST results were converted in a graphical map showing the entire sequences. From inside to outside, circle 1 indicates the G+C content, circles 2 to 5 represent CFBP 7634, CFBP 7651, CFBP 7179, CFBP 2528 locus-tags. The external circle shows COG classification of CDSs with different colors according to the legend. In circles 2 to 5, the color indicates the BLAST score (see legend).

