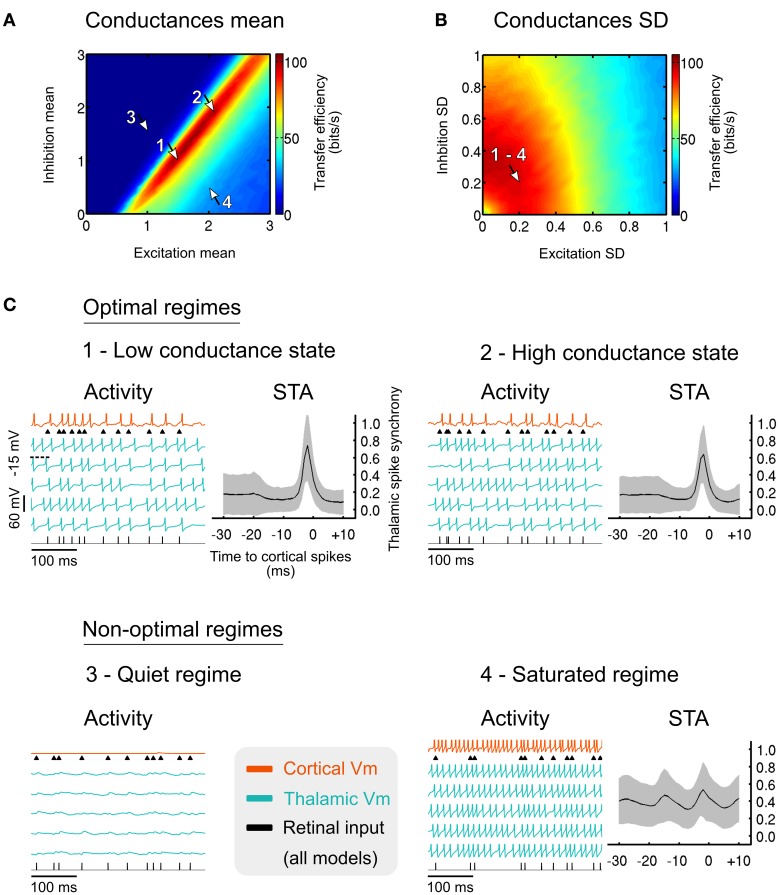
Figure 6.
(A) Effect of the cortical excitatory and inhibitory mean input conductances on the sensory transfer efficiency. Mean conductances were normalized relative to the resting conductance of the thalamic cells. Arrows indicate specific operating regimes illustrated in (C). The normalized conductance standard deviations were normalized relative to their respective means, and set to 0.2 for both excitation and inhibition. (B) Similar to (A) for the standard deviation of the excitatory and inhibitory conductances. The normalized conductance means were set to 1.5 for the excitation and 1.0 for the inhibition. (C) Membrane voltage traces for the four specific regimes denoted by the arrows in (A,B). The thalamic spike synchrony was measured with cortical spike-triggered average. The number of thalamic spikes evoked in the corresponding regimes was averaged using a bin size of 1 ms and was then normalized to the total number of TC cells. Grayed areas represent the standard deviation of the counts across all cortical spikes (n > 103 in every bin). Modified from Béhuret et al. (2013).

