Figure 7.
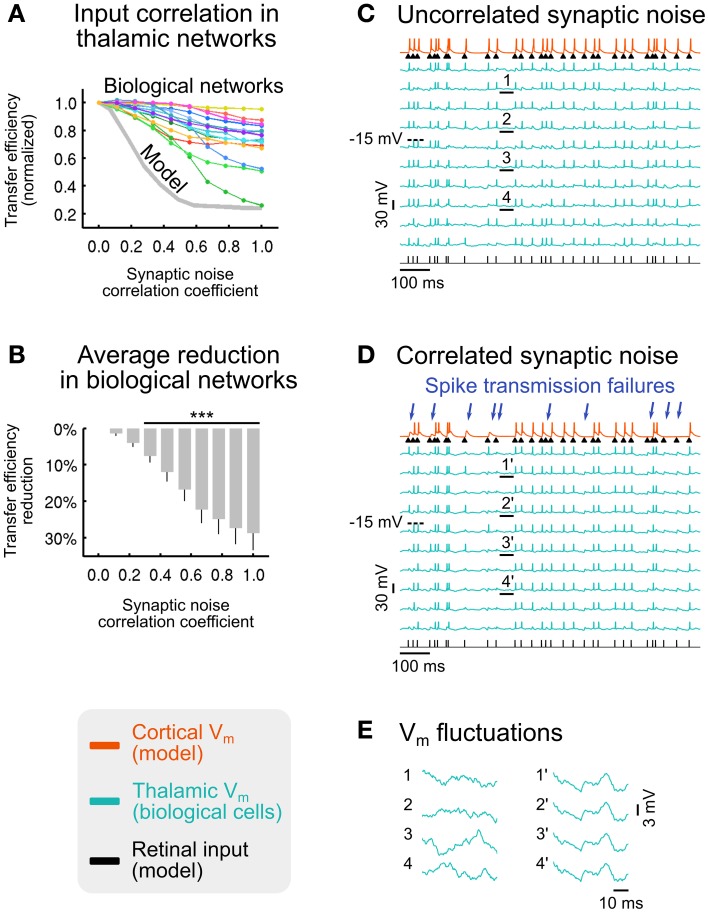
Effect of synaptic noise correlation across TC cells on sensory information transfer. (A) Normalized transfer efficiency in model (gray curve) and biological networks (colored curves) for increasing levels of synaptic noise correlation across thalamic neurons. (B) Average transfer efficiency reduction (± SEM) across all biological networks shown in (A) (***p < 3.10−4; t-test; n = 15). (C) Illustration of voltage traces for a biological network receiving uncorrelated synaptic bombardment. (D) Same biological network as in (C) receiving correlated synaptic bombardment. Retinal spikes that were detected by the recipient cortical neuron in (C) but not detected in (D) are indicated by blue arrows. (E) Zoomed sections of membrane potential fluctuations underlined in (C) (sections 1–4; uncorrelated synaptic bombardment) and (D) (sections 1'–4'; correlated synaptic bombardment). Modified from Béhuret et al. (2013).

