
Figure 11.
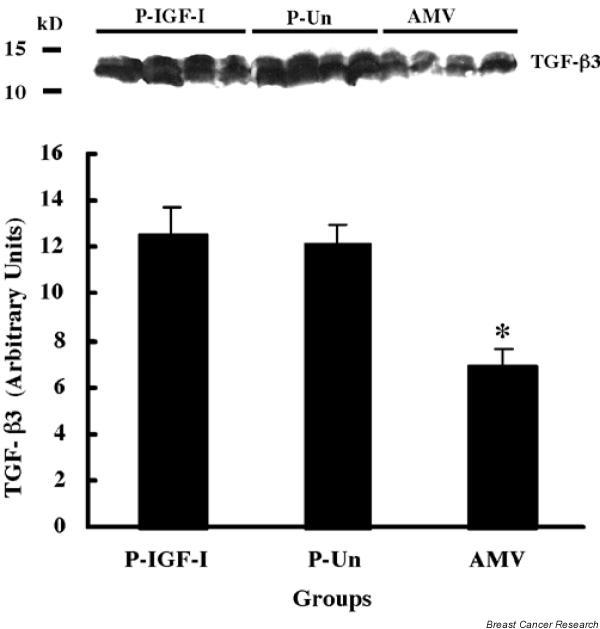
Levels of transforming growth factor (TGF)-β3 in mammary glands obtained from parous rats treated with insulin-like growth factor (IGF)-I (P-IGF-I), untreated parous rats (P-Un), and age-matched virgin rats (AMV). The IGF-I treatment (0.66 mg/kg body weight/day) was continued for 7 days before samples were collected. Protein samples (100 μg/lane) were electrophorized on a 20% SDS-PAGE; Western blot analysis was carried out using a specific anti-TGF-β3 antibody (GF16; Oncogene Research Product, San Diego, CA, USA) and specific protein bands detected using enhanced chemiluminescence reagents. The upper image shows the results of the Western blot analysis and the bar chart shows the quantitation and statistical analysis of the results. Values are expressed as mean ± standard error. *P < 0.05 versus P-Un and P-IGF-I.