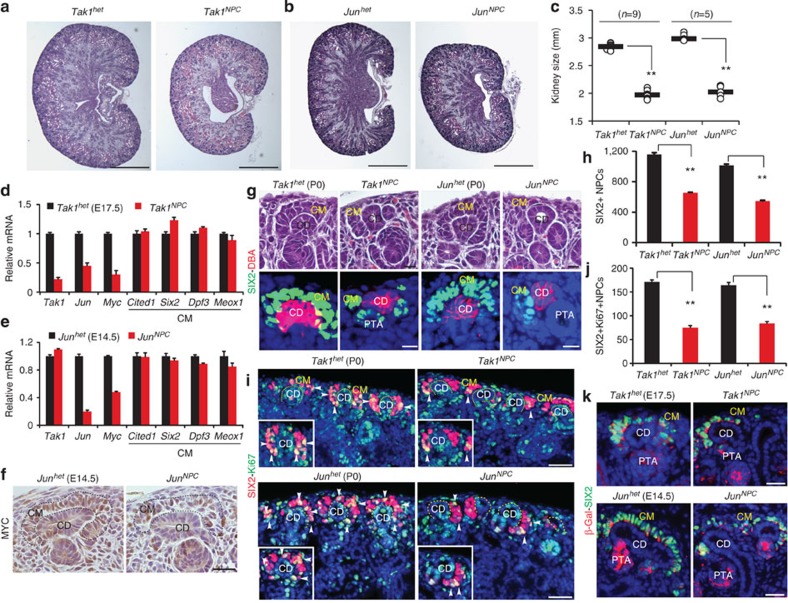
Figure 3. Tak1 and Jun are required for self-renewal of NPCs throughout nephrogenesis.
(a,b) H&E staining of P0 Tak1het, Tak1NPC, Junhet and JunNPC kidneys. Scale bars, 500 μM (c) Kidney sizes. Number of mice (n) analysed per group is noted in the graph. **P<0.005, Student's t-test. (d,e) Transcriptional analysis of Tak1, Jun, Myc and cap mesenchyme markers in NPCs isolated from E17.5 Tak1het, Tak1NPC and E14.5 Junhet, JunNPC kidneys. Error bars represent s.d. Two biological replicates analysed per genotype, n=2. (f) MYC immunostaining of E14.5 Junhet and JunNPC kidneys. Scale bars, 50 μM. (g) H&E and co-immunostaining of SIX2 (green, cap mesenchyme) and DBA lectin (red, collecting duct) of P0 Tak1NPC and JunNPC kidneys. Scale bars, 25 μM. (h) Average number of SIX2+ NPCs per kidney section per genotype. Error bars indicate s.d. **P<0.005, Student's t-test. (i) Ki67 (green) and SIX2 (red) co-immunostaining of P0 Tak1het, Tak1NPC, Junhet, JunNPC kidneys. Insets show magnifications of cap mesenchymes with arrows pointing to Ki67+ cells. Scale bars, 100 μM. (j) Number of SIX2+/Ki67+ cells per kidney section. Error bars represent s.d. and **P<0.005, Student's t-test (k) β-galactosidase (red) and SIX2 (green) co-immunostaining of E17.5 Tak1het (Six2+/cre;Tak1+/c;R26RLacZ) and Tak1NPC (Six2+/cre;Tak1c/c;R26RLacZ) kidneys. Three mice were analysed per genotype at E14.5 and E17.5 (n=3). CD, collecting duct; CM, cap mesenchyme; PTA, pre-tubular aggregate.

