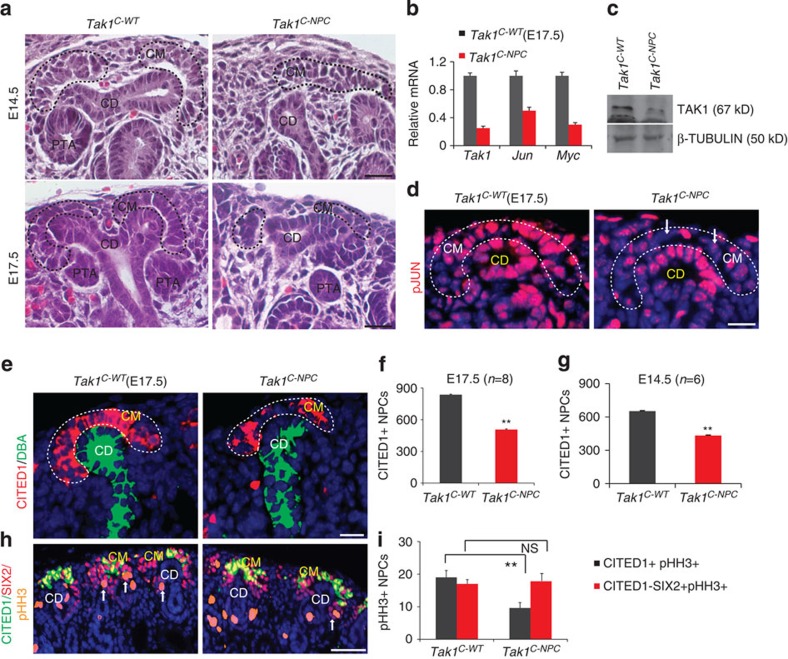
Figure 4. BMP7-mediated TAK1 signalling is required for proliferation of CITED1+ NPCs.
(a) H&E staining of E14.5 and E17.5 Tak1C-WT and Tak1C-NPC kidneys shows nephrogenic units in which cap mesenchymes are outlined with black dashed lines. Scale bars, 50 μM (b) RT–qPCR of Tak1, Jun and Myc in NPCs isolated from E17.5 Tak1C-WT and Tak1C-NPC kidneys. Error bars indicate s.d. Two biological replicates analysed per genotype (n=2). (c) Immunoblot of TAK1 and β-Tubulin in NPCs isolated from E17.5 Tak1C-WT and Tak1C-NPC kidneys (Supplementary Fig. 4c). (d) pJUN immunostaining of E17.5 Tak1C-WT and Tak1C-NPC kidneys. Scale bars, 50 μM. (e–g) CITED1 (red) and DBA lectin (green) staining of E17.5 Tak1C-WT and Tak1C-NPC kidneys. Quantitation of numbers of CITED1+ cells per E14.5 and E17.5 kidney section per genotype. Number of mice (n) per genotype is noted in the graph. Error bars represent s.d. **P<0.005, Student's t-test. (h,i) CITED1 (green), SIX2 (red) and pHH3 (orange/proliferation marker) staining in E17.5 Tak1C-WT and Tak1C-NPC. Scale bars, 150 μM. Quantitation of numbers of pHH3+/CITED1+/SIX2+ versus pHH3+/CITED1−/SIX2+ cells per kidney section per genotype. Error bars indicate s.d. **P<0.005 and P=0.08 (NS, not significant), Student's t-test. Cap mesenchymes highlighted with black or white dotted lines. CD, collecting duct; CM, cap mesenchyme; PTA, pre-tubular aggregate.

