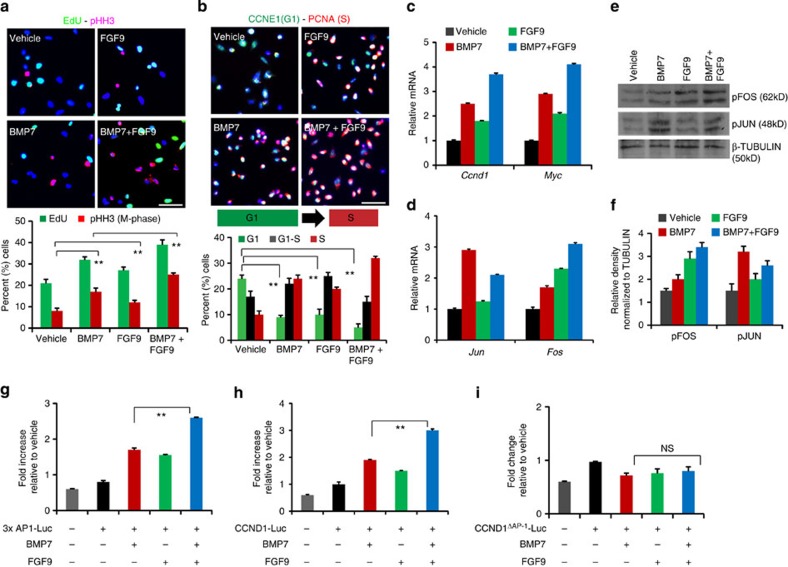
Figure 6. Combinatorial BMP7 and FGF9 signalling controls AP-1 function in NPCs.
(a) Immunostaining of EdU (S-phase) and pHH3 (M-phase), (b) CCNE1 (G1-phase) and PCNA (S-phase) in E17.5 NPCs stimulated with vehicle, BMP7, FGF9 or BMP7+FGF9 for 24 h. Scale bars, 50 μM. Graphs show the percentage of EdU+,pHH3+ cells and G1, G1-S and S-phase cells in each condition. Error bars represent mean (s.d.). **P<0.005 and P<0.001 (Student's t-test). Two to three biological replicates analysed per condition (n=2 in a) and (n=3 in b) (c,d) RT–qPCR of cell cycle genes (Ccnd1 and Myc), Jun and Fos in NPCs stimulated with vehicle, BMP7, FGF9 or BMP7+FGF9 for 2 h. Error bars represent s.d. Three biological replicates analysed per condition, n=3. (e,f) pJUN and pFOS immunoblot of NPCs stimulated with vehicle, BMP7, FGF9 or BMP7+FGF9 for 20 min. Graph shows the relative density of pJUN and pFOS normalized to β-tubulin in each condition (Supplementary Fig. 6e). (g–i) Bars in the graphs represent the average fold change in luciferase activity of 3xAP1-Luc, CCND1-Luc and CCND1ΔAP-1-Luc in NPCs stimulated with BMP7 and FGF9 relative to vehicle treatment for 24 h. Three biological replicates analysed per condition (n=3). Error bars represent s.d. **P<0.005, NS, not significant P>0.05, Student's t-test.

