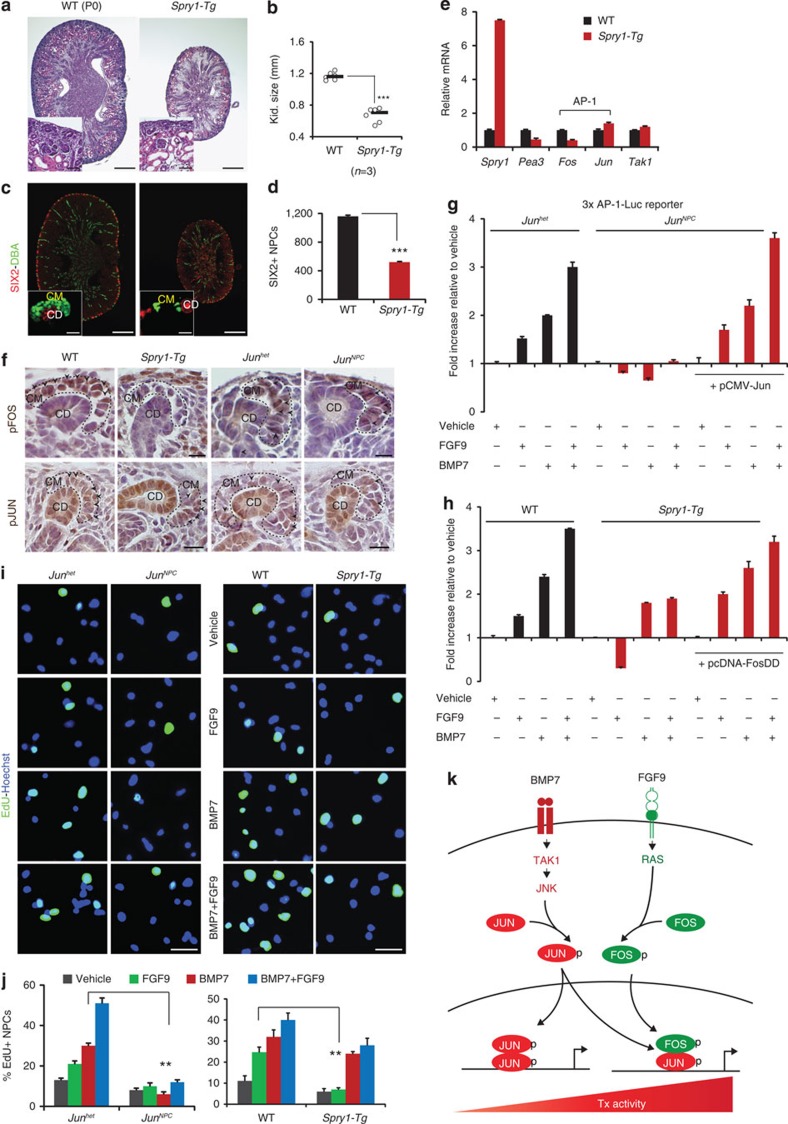
Figure 7. Jun is essential for AP-1 activation by BMP7 and FGF9 in NPCs.
(a) H&E staining of P0 WT (Six2-cre or Spry1-Tg littermate controls) and Spry1-Tg (Six2-cre;Spry1-Tg) kidneys. Insets show higher magnification images of the nephrogenic zone. Scale bars, 500 and 50 μM. (b) Kidney size of P0 WT and Spry1-Tg kidneys. ***P<0.0005, Student's t-test. Number of mice (n) per genotype is noted in the graph. (c) SIX2 (red, cap mesenchyme) and DBA lectin (green, collecting duct) immunostaining of Spry1-Tg kidneys. Scale bars, 500 and 25 μM (d) Number of SIX2+ NPCs per section in P0 WT and Spry1-Tg kidneys. Error bars represent s.d. ***P<0.0005, Student' t-test. (e) RT–qPCR of Spry1, Pea3 (FGF-target), Fos and Jun (AP-1 components) and Tak1 in E17.5 WT and Spry1-Tg NPCs. Two biological replicates analysed per genotype (n=2). Error bars represent s.d. (f) Immunostaining of pFOS and pJUN (black arrows) on P0 WT, Spry1-Tg and Junhet, JunNPC kidneys. Scale bars, 50 μM. (g,h) Luciferase activity relative to vehicle treatment in E17.5 Junhet, JunNPC and WT, Spry1-Tg NPCs transfected with 3 × AP1-Luc and pCMV-JUN or pcDNA-FOSDD and treated with BMP7, FGF9 and BMP7+FGF9 for 24 h. Error bars represent s.d. Three biological replicates analysed per condition (n=3). (i,j) EdU labelling (green, proliferation marker) of E17.5 NPCs isolated from Junhet, JunNPC and WT and Spry1-Tg kidneys and treated with vehicle, BMP7, FGF9 and BMP7+FGF9 for 24 h. Average number of EdU+ NPCs scored in each condition. Two biological replicates analysed per condition (n=2). Error bars represent s.d. **P<0.005, Student's t-test. Scale bars, 50 μM. (k) Model for BMP7 and FGF9 collaborative regulation of NPC self-renewal. CD, collecting duct; CM, cap mesenchyme.

