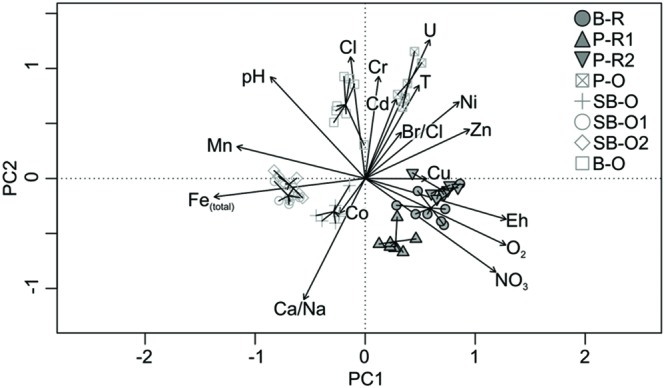
FIGURE 2.

Principal component analysis (PCA) plot of hydrogeochemical data measured in groundwater from three hard-rock aquifers. The first and second principal components (PC1 and PC2) account for 27 and 17% of variance, respectively. The plot includes groundwater samples from all wells, including P-O and SB-O which were not used in the microbial diversity analysis. Recent groundwater samples are represented by closed symbols and old groundwater samples by open symbols. Abbreviations : B-R, Betton-Recent; P-R1, Ploemeur-Recent 1; P-R2, Ploemeur-Recent 2; P-O, Ploemeur-Old; SB-O, Saint-Brice-Old; SB-O1, Saint-Brice-Old 1; SB-O2, Saint-Brice-Old 2; B-O, Betton-Old; T, temperature.
