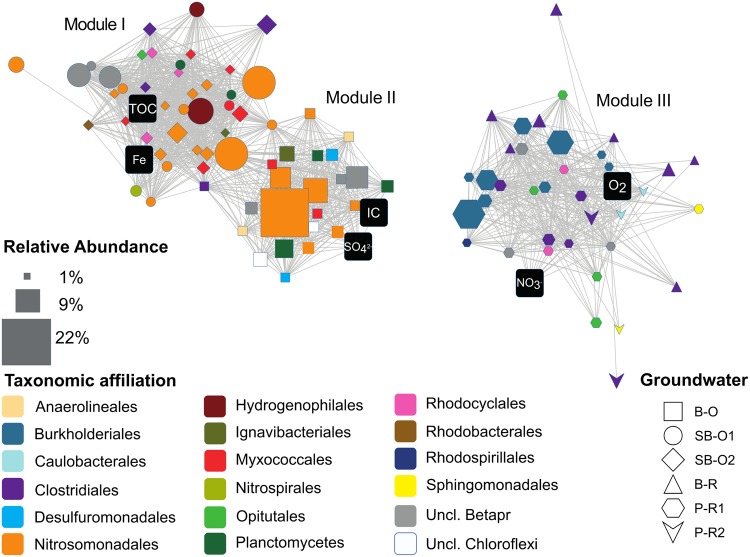
FIGURE 5.
Network of structural correlations between and among OTU and hydrogeochemical variables. Edges represent positive and significant correlations. Nodes depicted as black squares represent hydrogeochemical variables. The other nodes are OTUs with relative abundances ≥1%. Additional information is mapped onto OTU nodes to facilitate interpretation of the network: node size is the maximum abundance of the OTU across samples; node shape represent samples where the OTU is the most prevalent; node color represents the taxonomic assignment. Abbreviations: TOC, Total Organic Carbon; IC, Inorganic Carbon; Fe, total dissolved iron; Uncl, unclassified; Betapr, Betaproteobacteria; B-O, Betton-Old; SB-O1, Saint-Brice-Old 1; SB-O2, Saint-Brice-Old 2; B-R, Betton-Recent; P-R1, Ploemeur-Recent 1; P-R2, Ploemeur-Recent 2.

