
Figure 1.
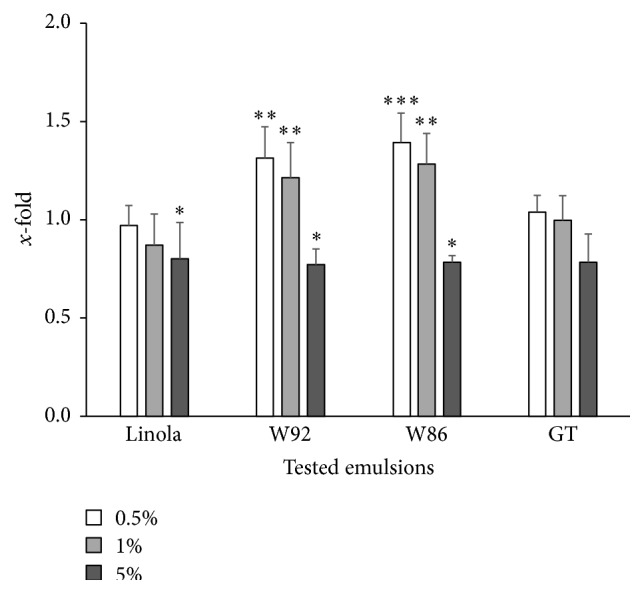
Proliferation of the V79 cells after 48-hour incubation with the tested emulsions in three different concentrations (0.5%, 1%, and 5%). Results of the SRB spectrophotometric assay obtained with the tested emulsions are presented as x-fold of the control culture (cells excluding previous incubation with the tested emulsions; value = 1) and are means of 8 independent experiments ± SD. Statistical significance of differences between the results with the tested emulsions compared to those in the control cultures was calculated with t-test for independent samples (∗ p < 0.05, ∗∗ p < 0.01, and ∗∗∗ p < 0.001).