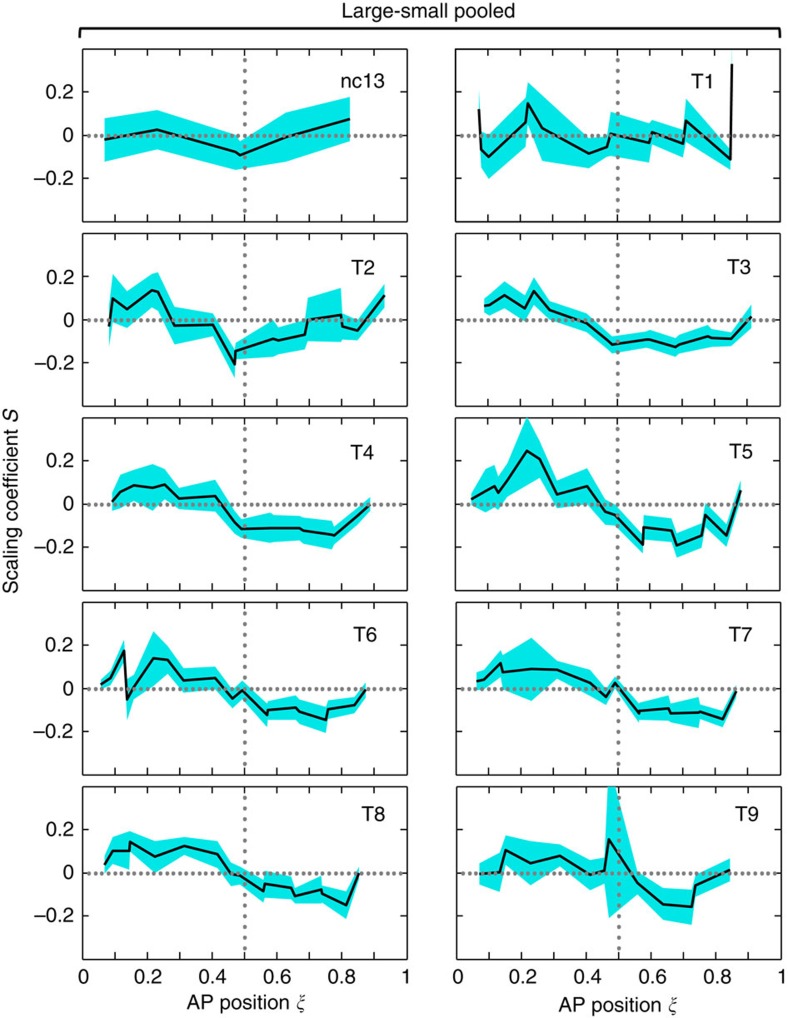
Figure 3. Scaling coefficient profiles as a function of AP position.
Shown are measured S profiles of gap expression boundaries plotted as a function of AP position at each of the 10 time classes, with blue bands representing 95% CI of S. The two dotted lines denote mid-embryo (relative AP position ξ=0.5) and perfect scaling (S=0), respectively.

