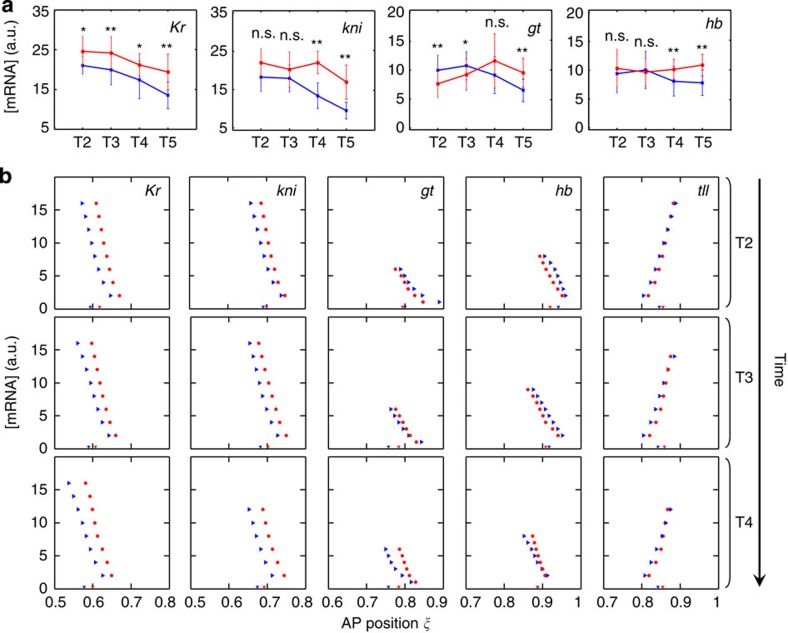
Figure 5. Large embryos exhibit weaker or weakening gap expression levels in the posterior.
(a) Gap gene expression levels in the posterior trunk region at T2–T5. For each embryo, the expression level is estimated as the mean across the three highest intensity bins of a domain. Blue and red denote large and small embryos, respectively. Error bars are s.d. Results of Student's t-tests are given, with n.s., * and ** denoting not significant, P<0.05 and P<0.01, respectively. (b) Shown are AP positions at which a mean intensity profile crosses given thresholds. The trailing boundaries for Kr, kni, gt and hb as well as the leading boundary of posterior tll domain are shown. Measured boundary positions of the large and small embryos are indicated at the bottom of each panel for reference. Blue, large embryos; red, small embryos. See Supplementary Table 1 for n.

