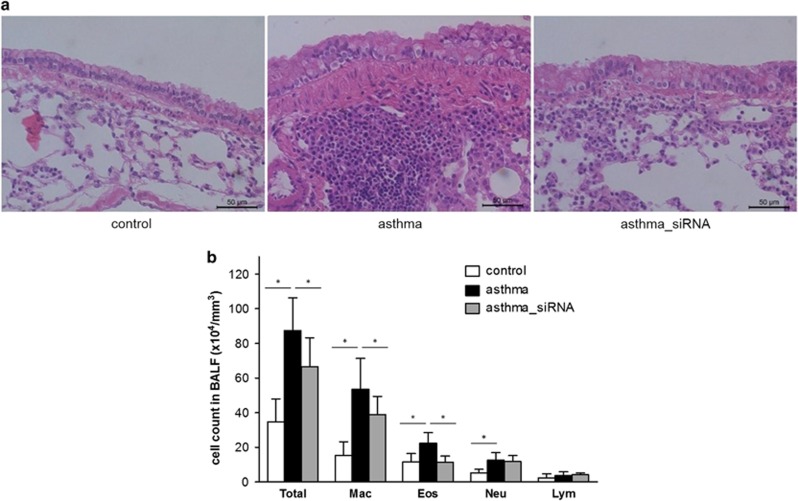
Figure 4.
Histology and inflammatory cell counts. (a) Hematoxylin and eosin staining of the lung tissue from the control mice, those with asthma and those with asthma treated with β-catenin siRNA (asthma_siRNA) and (b) the inflammatory cell counts in the bronchoalveolar lavage fluid. *P<0.05 between the two groups.

