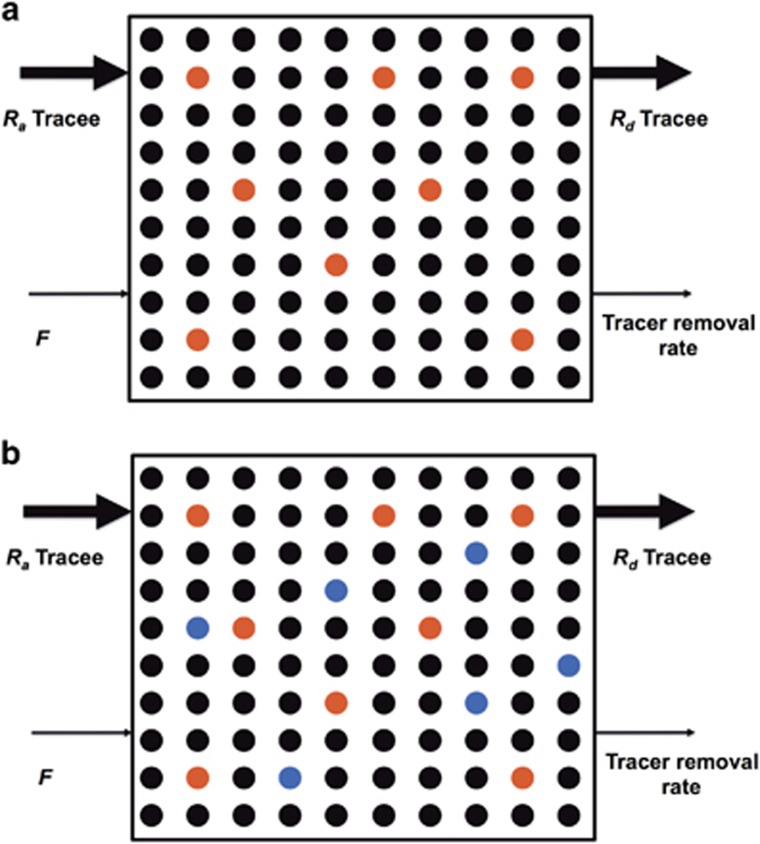
Figure 3.
Conceptual schematic diagrams of isotopic enrichment. The systemic circulation is depicted as rectangular boxes. Assume that one kind of compound (e.g., glucose) exists in circulation, and singly labeled glucose tracer (e.g., 1-13C-glucsoe, M+1) is administered. (a) Enrichment (e.g., tracer to tracee ratio, TTR) is simply the ratio of concentrations of tracer (red circle) to tracee (black circle), which is the ratio of 8 to 92 (TTR=0.087). (b) Some proportion of tracee is actually heavier than the most abundant form (typically, M+0). For example, 6.9% of naturally occurring glucose has mass of 181 (M+1, blue circle) when M+0 glucose is normalized to 100%. Because MS does not distinguish M+1 of tracee from M+1 of tracer, correction needs to be made by subtracting background enrichment from sample enrichment.

