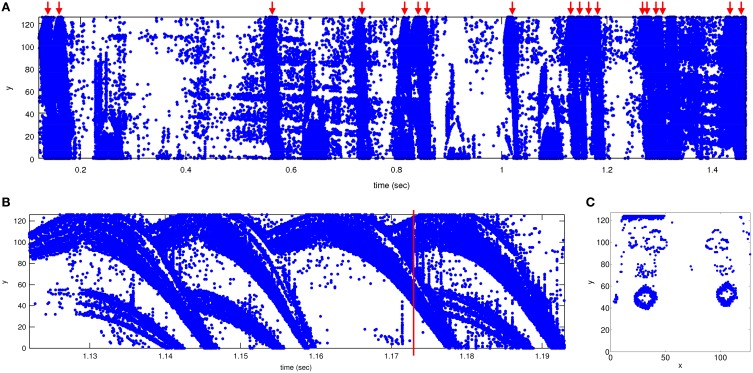
Figure 2.
Recorded events. Units for x and y are pixel coordinates (from 0 to 127) and time is in seconds. (A) Events recorded when browsing 18 cards, shown in y vs. time plane. Upper red arrows indicate the position of a card in time. Total time is 1.34 s. (B) Zoom-in between times 1.122 and 1.193 s showing 4 sequential cards. The 4 cards cross the 128 × 128 pixel screen in 24, 23, 26, and 23 ms, respectively. (C) Events collected between 300 μs before and after the time mark in (B) displayed as y vs. x. Note how the previous card (diamonds) disappears at the bottom and the next card (clubs) appears at the top. Matlab scripts to reproduce these figures are included in the Supplementary Material.

