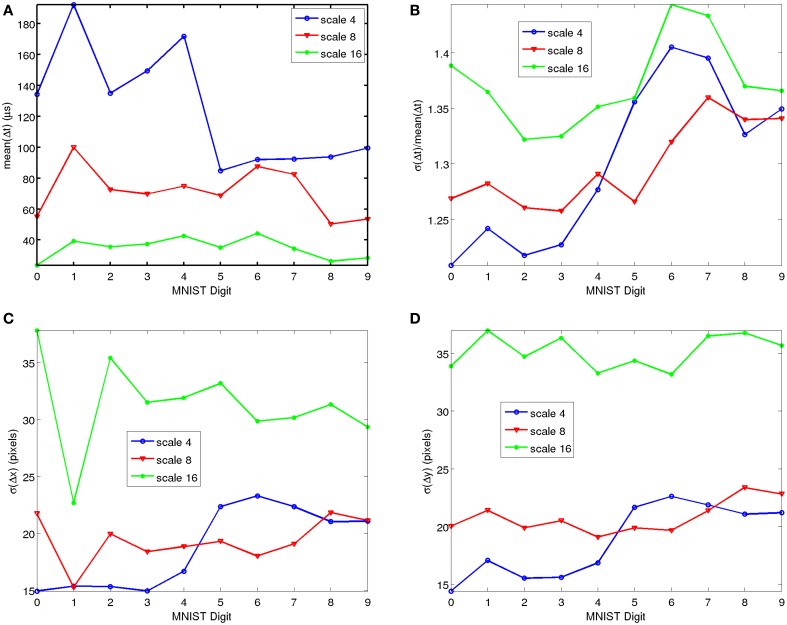
Figure 5.
Simple Statistical Analyses of recorded MNIST-DVS data, as function of MNIST symbol and for the three different scales. (A) Average inter-spike time difference. (B) Relative Standard Deviation of inter-spike time differences. (C) Standard Deviation of consecutive event x coordinate differences. (D) Standard Deviation of consecutive event y coordinate differences. Matlab scripts to reproduce these figures are included in the Supplementary Material.

