Figure 3.
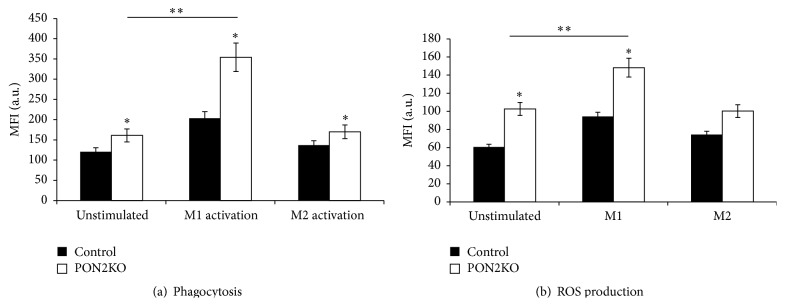
M1 functional phenotype in PON2KO MPM versus control mice MPM. MPM from control or PON2KO mice were either nontreated or activated to the M1 or M2 phenotype. (a) Phagocytosis was determined in cells that were incubated with FITC-conjugated latex beads for 4 hours and analyzed using FACS. Results are given as mean fluorescence intensity (MFI). (b) ROS production was analyzed by FACS and is expressed as MFI. Results are expressed as mean ± SD (n = 3), ∗ P < 0.05, PON2KO MPM versus control MPM; ∗∗ P < 0.01, M1 stimulated versus unstimulated cells.

