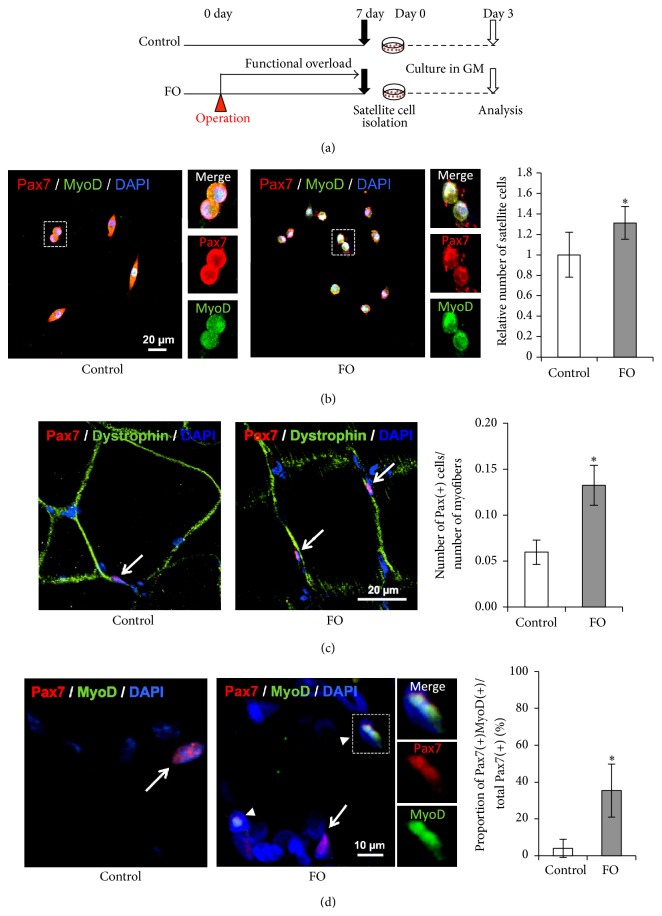
Figure 2.
Satellite cell activation and proliferation following functional overload. (a) Schematic representation of the experimental design. FO group rats had a surgical operation to ablate synergistic muscles and received functional overload stimulation for 1 week. Satellite cells were isolated from plantaris of each group of rats 7 days after operation and were cultured in growth medium for 3 days. (b) Immunocytochemistry analysis of cultivated-satellite cells. Representative merged images of immunocytochemistry staining for Pax7 (red) and MyoD (green) with DAPI from control group (left panel) and FO group (right panel) are shown. Magnification of the area surrounded by the dotted square is shown in the right panels. Relative number, normalized to the number observed for the control group, of Pax7(+)MyoD(+) cells is shown in the right graph. (c, d) Immunohistochemistry analysis of satellite cells following functional overload. Representative merged images of immunohistochemistry staining for Pax7 (red) and Dystrophin (green) (c) or for Pax7 (red) and MyoD (green) (d) with DAPI from control group (left panel) and FO group (right panel) are shown. Magnification of the area surrounded by the dotted square is shown in the right panels. The proportion of Pax7(+) cells per myofibers (c) or the proportion of Pax7(+)MyoD(+) cells per total Pax7(+) cells (d) is shown in the right graphs. White arrows and arrowheads indicate Pax7(+) cells and Pax7(+)MyoD(+) cells, respectively. All values are expressed as mean ± SDM (n = 5). Significant differences: ∗ compared to control group (P < 0.05).

