Figure 3.
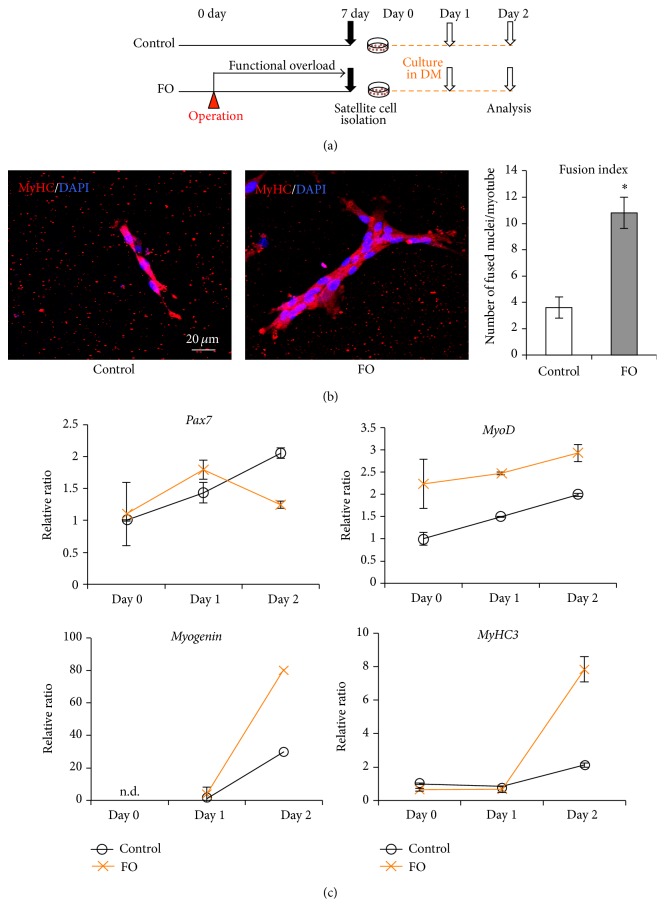
Acceleration of satellite cell differentiation following functional overload. (a) Schematic representation of the experimental design. FO group rats had a surgical operation to ablate synergistic muscles and received functional overload stimulation for 1 week. Satellite cells were isolated from plantaris of each group of rats 7 days after operation and were cultured in differentiation medium for 2 days. (b) Immunocytochemistry analysis of cultivated-satellite cells. Representative merged images of immunocytochemistry staining for MyHC (red) with DAPI from control group (left panel) and FO group (right panel) are shown. Fusion index, calculated to average the number of nuclei fused into a myotube, is shown in the right graph. (c) Expression profiles of stem cell markers in differentiation process of satellite cells. mRNA expression levels of Pax7 (upper left), MyoD (upper right), myogenin (lower left), and MyHC3 (lower right) in cultured cells were measured by qRT-PCR analysis on days 0, 1, and 2 (before and 1 and 2 days after inducing differentiation, resp.). In the graphs, black lines and orange lines represent control group and FO group, respectively. Target mRNA expression was normalized to that of GAPDH and then plotted as the expression ratio relative to the control group. All values are expressed as mean ± SDM (n = 5). Significant differences: ∗ compared to control group (P < 0.05). n.d.: not detectable.

