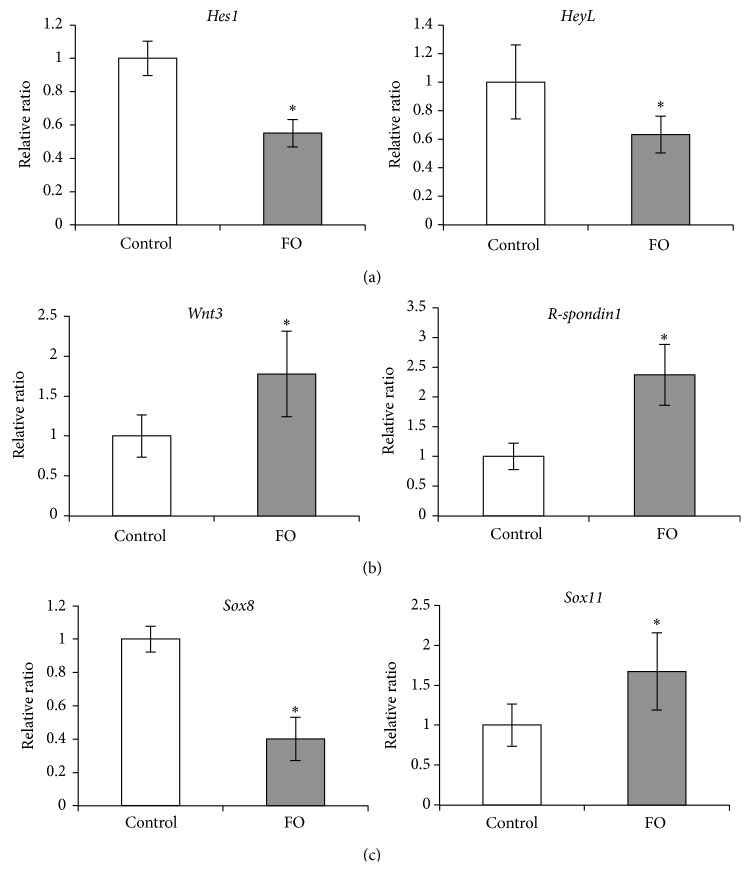
Figure 4.
Changes in Notch, Wnt, and Sox expression following functional overload. (a, b, c) Expression levels of Notch signaling-related genes, Wnt signaling-related genes, and Sox genes. Amounts of Hes1 and HeyL (a), Wnt3 and R-spondin1 (b), and Sox8 and Sox11 (c) mRNAs in the plantaris were measured by qRT-PCR analysis. Target mRNA expressions were normalized to that of RPL32 and then plotted as the expression ratio relative to control group. All values are expressed as mean ± SDM (n = 5). Significant differences: ∗ compared to control group (P < 0.05).

