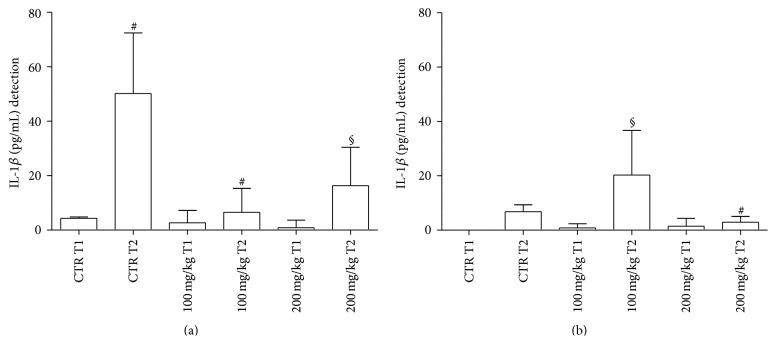
Figure 1.
Fish IL-1β levels from GP (a) and GT (b) supernatants after 2 h incubation. CTR = untreated samples; T1 = before treatment; T2 = at the end of treatment. Statistical analysis was performed using the GraphPad Prism statistical software release 5.0 for Windows Vista. Bonferroni's test was used for comparison between the controls and treated samples at both concentrations. Statistical significance was set at P < 0.05. (a) # P < 0.0001 CTR T1 versus CTR T2; # P < 0.0001 CTR T2 versus 100 mg/kg T2; § P < 0.01 CTR T2 versus 200 mg/kg T2. (b) § P < 0.01 100 mg/kg T1 versus 100 mg/kg T2; ∗ P < 0.05 100 mg/kg T2 versus 200 mg/kg T2.

