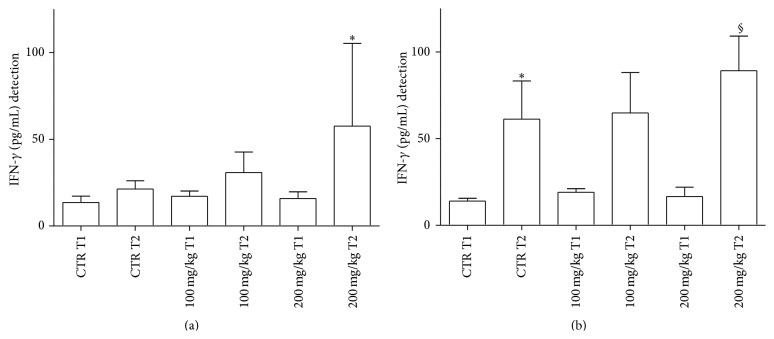
Figure 3.
IFN-γ levels released from GT (a) and spleen (b) supernatants after 2 h incubation. For abbreviations and statistical analysis see Figure 1. (a) ∗ P < 0.05 200 mg/kg T1 versus 200 mg/kg T2. (b) ∗ P < 0.05 CTR T1 versus CTR T2; § P < 0.01 200 mg/kg T1 versus 200 mg/kg T2.

