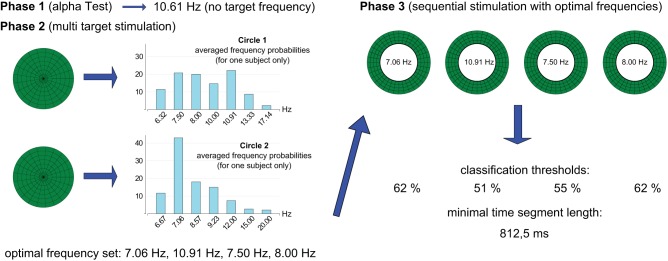
Figure 1.
Illustration of the calibration procedure for one subject. After EEG-data were recorded (subject's eyes closed) 10.61 Hz had the strongest SSVEP response and was determined as alpha wave frequency. As this frequency did not belong to the set of possible target frequencies no frequency was filtered out. In phase 2 (multi-target stimulation) EEG-data were recorded while the subject faced two circles in sequence (each for 10 s). The first circle presented the target frequencies 6.32, 7.50, 8.00, 10.00, 10.91, 13.33, and 17.14 Hz. The second circle presented 6.67, 7.06, 8.57, 9.23, 12.00, 15.00, and 20.00 Hz. Results from the EEG recordings are displayed in the diagrams. In phase three, frequencies with the highest SSVEP-responses from both recordings were presented in series, and corresponding SSVEP key parameters were calculated.

