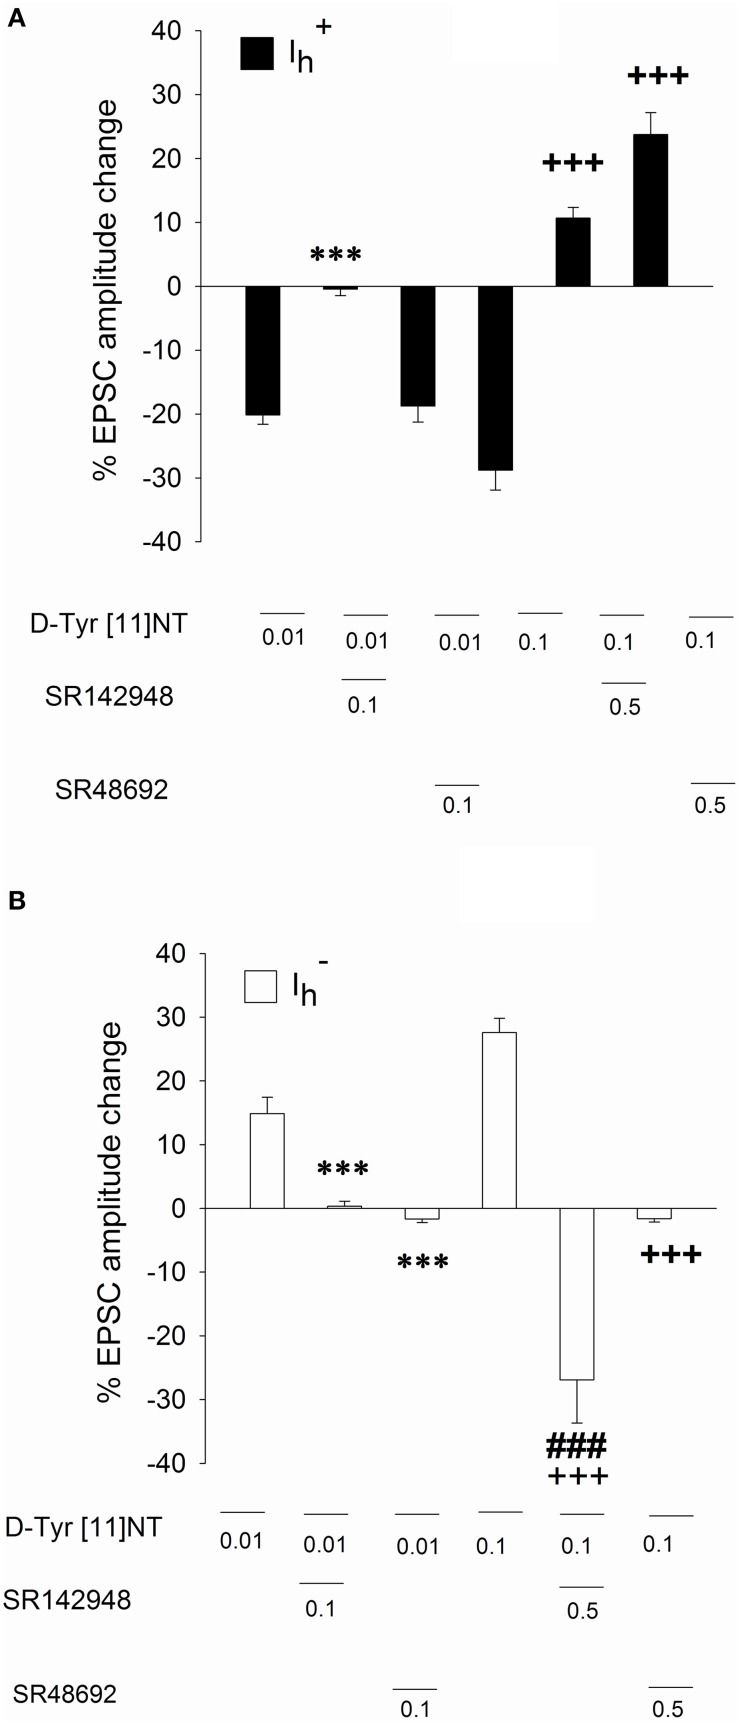
Figure 7.
Effect of SR142948 and SR48692 on glutamatergic EPSCs in and neurons. Mean percent change in EPSC amplitude recorded in (A) and neurons (B) following application of [D-Tyr11]NT alone or in the presence of SR142948 or SR48692. The number of neurons recorded under each condition is as follow: neurons, [D-Tyr11]NT (0.01 μM, n = 6; 0.1 μM, n = 6); SR142948 (0.1 μM, n = 5; 0.5 μM, n = 4); SR48692 (0.1 μM, n = 4; 0.5 μM, n = 4); neurons, [D-Tyr11]NT (0.01 μM, n = 6; 0.1 μM, n = 6); SR142948 (0.1 μM, n = 5; 0.5 μM, n = 5); SR48692 (0.1 μM, n = 5; 0.5 μM, n = 4). All concentrations of D-Tyr[11]NT, SR142948, and SR48692 are reported in μM. Asterisks and crosses indicate a statistically significant difference with [D-Tyr11]NT alone at 0.01 μM and 0.1 μM respectively (***p < 0.001 with 0.01 μM; +++p < 0.001 with 0.1 μM). The ### sign indicates a statistical significant difference between SR142948 (0.5 μM) +D-Tyr[11]NT (0.1 μM) and SR48692 (0.5 μM) +D-Tyr[11]NT (0.1 μM). See text for details.

