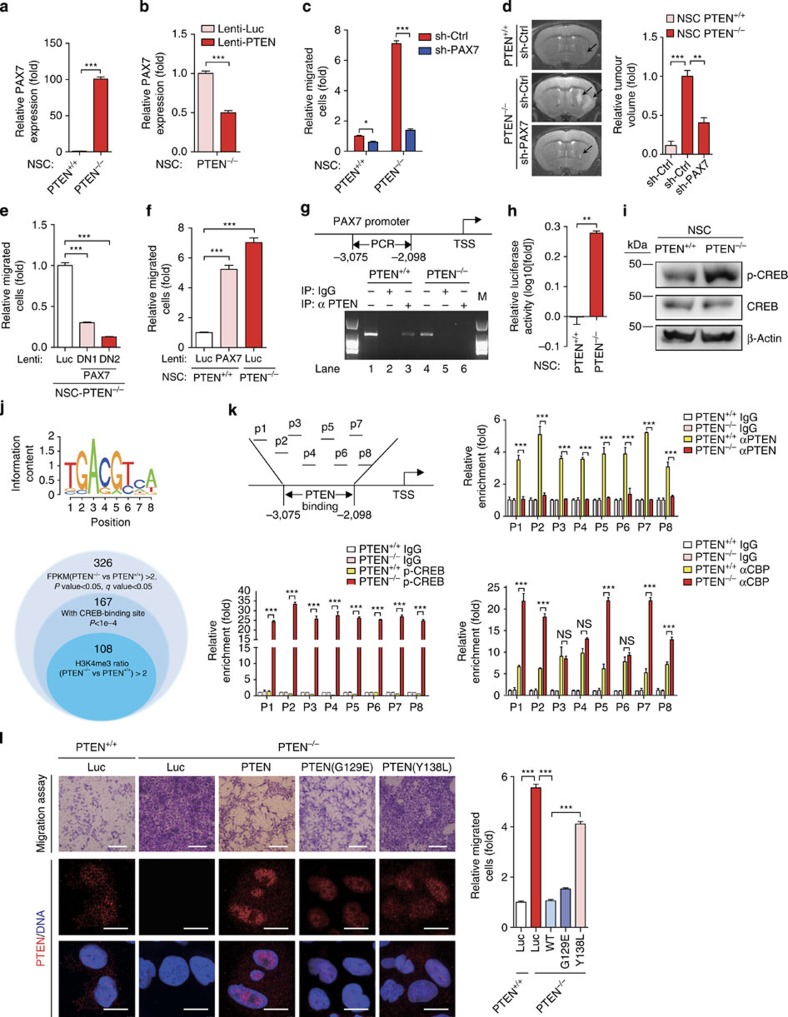
Figure 4. Transcriptional activation of PAX7 underlies oncogenic features in PTEN-deficient NSCs.
(a) RT–qPCR analyses of PAX7 expression in WT and PTEN−/− NSCs. n=3. ***P<0.001 (t-test). (b) RT–qPCR showing reduced transcripts of PAX7 in PTEN−/− NSCs transduced with lentivirus encoding PTEN. n=3. ***P<0.001 (t-test). (c) Cell migration analysis in WT and PTEN−/− NSCs transduced with control shRNA or PAX7 shRNA. n=5. *P<0.05 (t-test); and ***P<0.001 (t-test). (d) MRI analysis of intracranially implanted WT and PTEN−/− NSCs pre-transduced with control or PAX7 shRNA. Relative volumes of tumours are presented. n=4. **P<0.01 (t-test), and ***P<0.001 (t-test). (e) Cell migration analysis in PTEN−/− NSCs transduced with the lentiviral vector encoding dominant negative mutants of PAX7 (DN1: a.a.1–263; DN2: a.a.1–318) or a luciferase control (Luc). n=3. ***P<0.001 (t-test). (f) Cell migration analysis in WT NSCs transduced with the lentiviral vector encoding PAX7. n=3. ***P<0.001 (t-test). (g) ChIP-PCR showing the association of endogenous PTEN with PAX7 promoter in WT NSCs. The PAX7 promoter was amplified by PCR from either genomic DNA as input (lanes 1 and 4) or anti-PTEN immunoprecipitated DNA (lanes 3 and 6). (h) Luciferase reporter assay showed that the PTEN-docking DNA element described in g has a higher cis-activation ability when PTEN was depleted in NSCs. n=3. **P<0.01 (t-test). (i) Immunoblotting analysis of CREB and phospho-CREB (Ser133) expression in WT and PTEN−/− NSCs. β-Actin was used as loading control. (j) Upper panel: Identification of CRE-containing genes in the human genome by the FIMO software tool. Lower panel: Bioinformatic analysis predicated that 167 (51.2%) of 326 genes upregulated in PTEN−/− NSCs are potential CREB-targets. (k) ChIP-qPCR analysis for PTEN, p-CREB and CBP enrichment within the PTEN-docking DNA region at the PAX7 promoter in WT and PTEN−/− NSCs. P1–P8 indicate the different sub-regions. ***P<0.001 (t-test); NS, not significant. (l) Cell migration analysis (top panels) of PTEN−/− NSCs transduced with the lentiviral vector encoding PTEN, PTEN(G129E), PTEN(Y138L) or a luciferase control (Luc), and the expression of PTEN was determined by immunofluorescence (lower panels). Scale bars, 1 mm (migration assay) and 50 μm (IF). n=3. ***P<0.001 (t-test).

