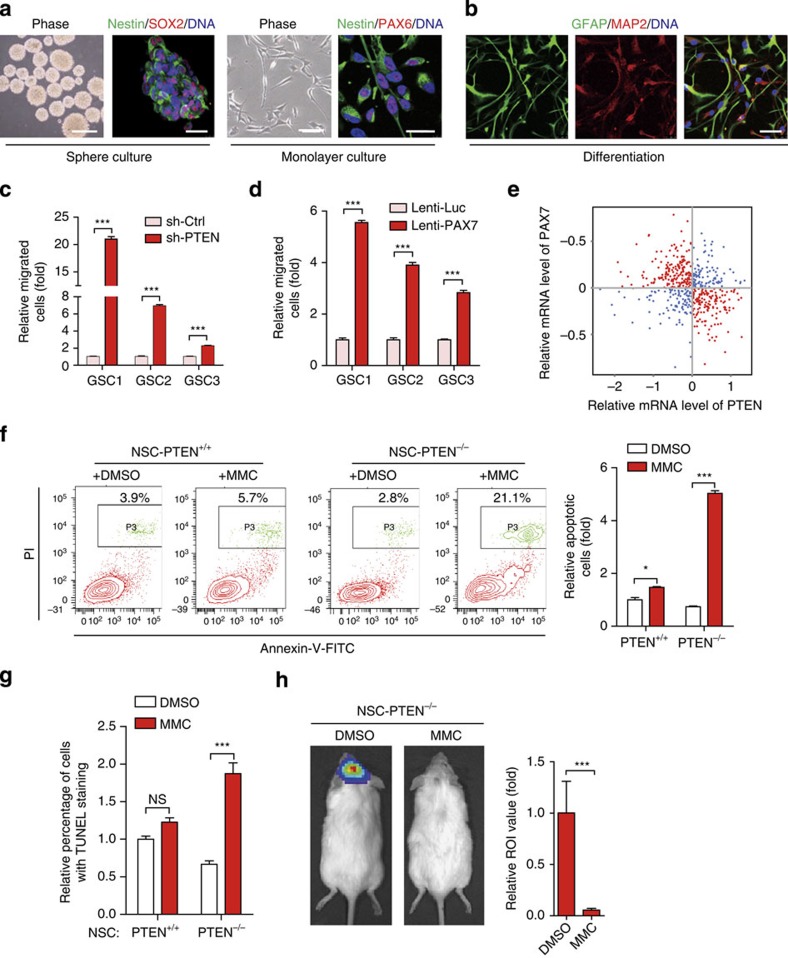
Figure 5. PTEN-PAX7 axis functions in GSCs and GBMs.
(a,b) Immunofluorescence analysis of the indicated antigens in GSCs (a) and their spontaneously differentiated derivatives (b). Scale bars, 1 mm (phase) and 25 μm (IF). (c,d) Cell migration assay indicating increased cellular mobility in PTEN-knocked down (c) or PAX7-overexpressed (d) GSC lines. n=3. ***P<0.001 (t-test). (e) GBM microarray data were obtained from TCGA website and spearman correlation was calculated by all the samples which were plotted by red and blue dots. The gene expression level was log2 lowess normalized. PAX7 expression negatively correlated with PTEN (Spearman correlation coefficient=−0.28, P value=1.0 × 10⁻¹¹). (f,g) FACS (f) and TdT-mediated dUTP nick end labelling (g) analyses of cell apoptosis in MMC (7.5 μM, 24 h) or vehicle-treated WT and PTEN−/− NSCs. n=6. *P<0.05 (t-test); ***P<0.001 (t-test); NS, not significant. (h) Representative bioluminescent images of PTEN−/− NSCs implanted animals in the presence or absence of MMC treatment are shown at day 70 after injection (left). Right panel indicates average bioluminescent signals. n=5 for dimethylsulphoxide (DMSO) treatment, and n=8 for MMC treatment. ***P<0.001 (t-test).

