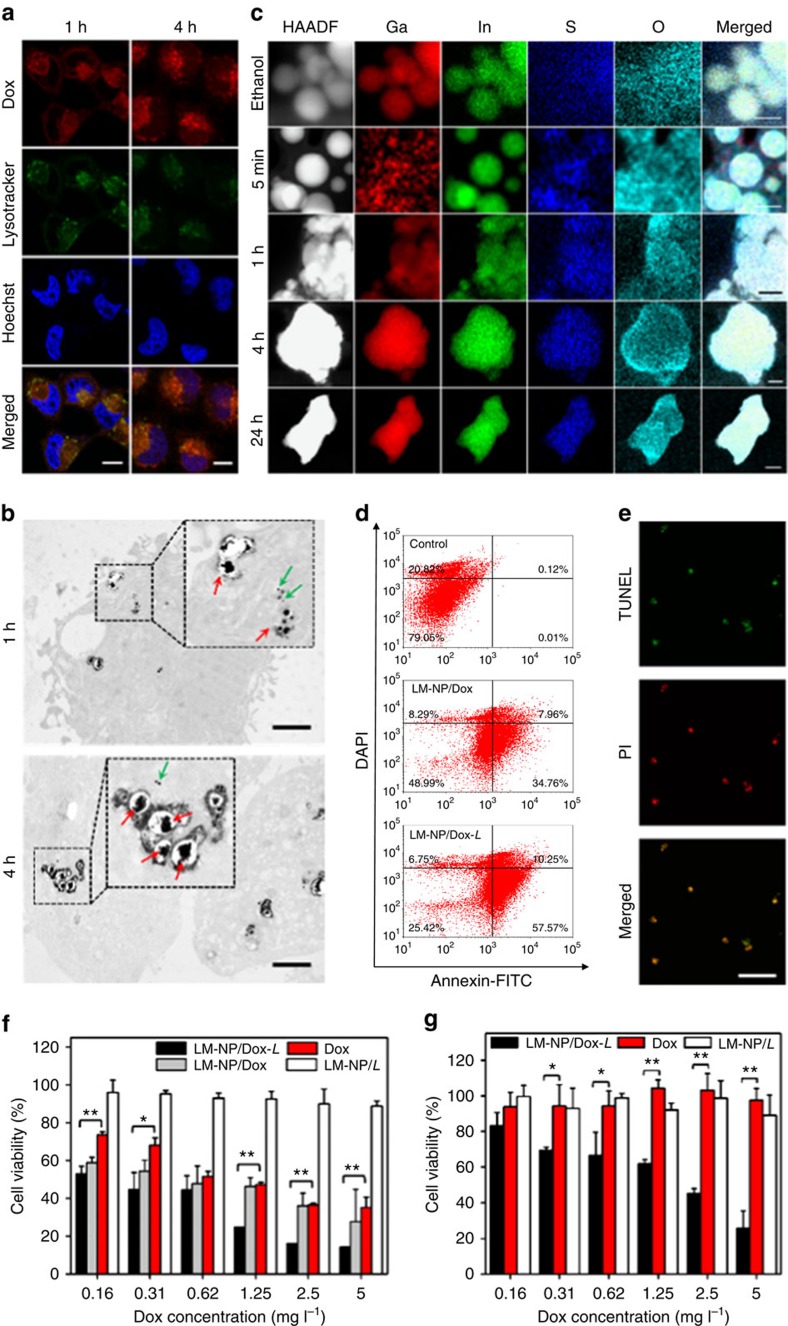
Figure 3. Intracellular interaction and drug release.
(a) Intracellular delivery of LM-NP/Dox-L towards HeLa cells at different time points observed by confocal laser scanning microscopy. The cells were incubated with LM-NP/Dox-L at 37 °C for 1 and 4 h, respectively. The late endosomes and lysosomes were stained with LysoTracker Green, and the nuclei were stained with Hoechst 33342. Scale bar, 10 μm. (b) Representative TEM images of HeLa cells incubated with LM-NP/Dox-L for 1 and 4 h. Red arrows show fused nanospheres; green arrows show dispersion of single nanosphere in the cytosol. Scale bar, 2 μm. (c) Element mapping results of intracellular LM-NPs/Dox-L collected from HeLa cells after different incubation times. Scale bars, 100 nm (for 5 min); 100 nm (for 1 h); 100 nm (for 4 h); 200 nm (for 24 h). (d) Flow cytometric analysis of HeLa cell apoptosis induced by LM-NP/Dox-L for 12 h using the Annexin V-FITC/4,6-diamidino-2-phenylindole (DAPI) staining. (e) HeLa cell apoptosis induced by LM-NP/Dox-L for 20 h using the APO-BrdU TUNEL assay. (f) In vitro cytotoxicity of LM-NP/Dox and LM-NP/Dox-L on HeLa cells for 24 h. Error bars indicate s.d. (n=4). Note: the concentration of LM-NP/L is equal to the nanocarrier concentration of Dox-loaded formulations in each corresponding group; the error bars in f (group LM-NP/Dox-L at concentrations 1.25, 2.5 and 5 mg l−1) are small. (g) In vitro cytotoxicity of LM-NP/Dox-L on Dox-resistant HeLa cells for 24 h. Error bars indicate s.d. (n=4). Note: the concentration of LM-NP/L is equal to the nanocarrier concentration of Dox-loaded formulations in each corresponding group. *P<0.05, **P<0.01 compared with the Dox solution group (two-tailed Student's t-test).

