
Figure 2.
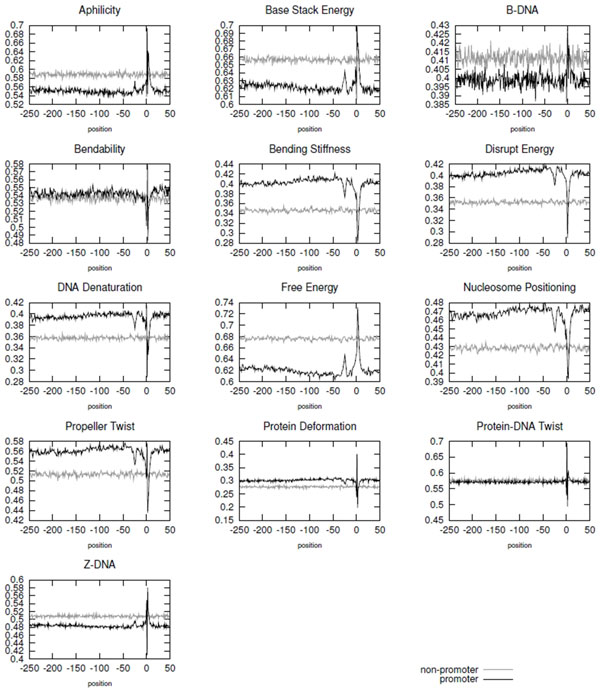
Average structural profile of thirteen features along promoter and non-promoter sequences of the 250-50 dataset. Each graph corresponds to a different structural property, and the property name is presented on the top of the graph.
Official websites use .gov
A
.gov website belongs to an official
government organization in the United States.
Secure .gov websites use HTTPS
A lock (
) or https:// means you've safely
connected to the .gov website. Share sensitive
information only on official, secure websites.
Average structural profile of thirteen features along promoter and non-promoter sequences of the 250-50 dataset. Each graph corresponds to a different structural property, and the property name is presented on the top of the graph.