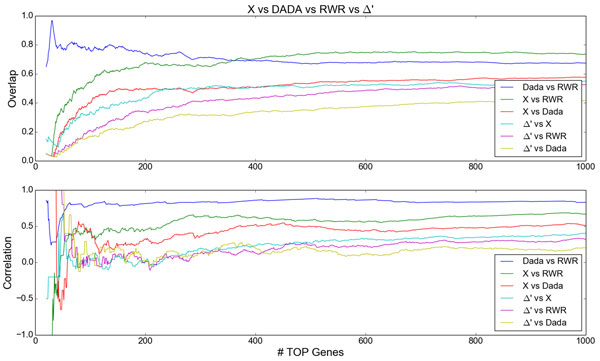
Figure 3.

Comparison of the methods DADA, RWR, X and Δ', varying the number of top genes considered by each method. Top: intersections (in proportion) between list pairs of top N genes obtained by each pair of methods. Bottom: Spearman correlations between list pairs of top N genes obtained by each pair of methods.
