. 2015 Dec 16;16(Suppl 13):S8. doi: 10.1186/1471-2164-16-S13-S8
Copyright © 2015 Moskalev et al.
This is an Open Access article distributed under the terms of the Creative Commons Attribution License (http://creativecommons.org/licenses/by/4.0), which permits unrestricted use, distribution, and reproduction in any medium, provided the original work is properly cited. The Creative Commons Public Domain Dedication waiver (http://creativecommons.org/publicdomain/zero/1.0/) applies to the data made available in this article, unless otherwise stated.
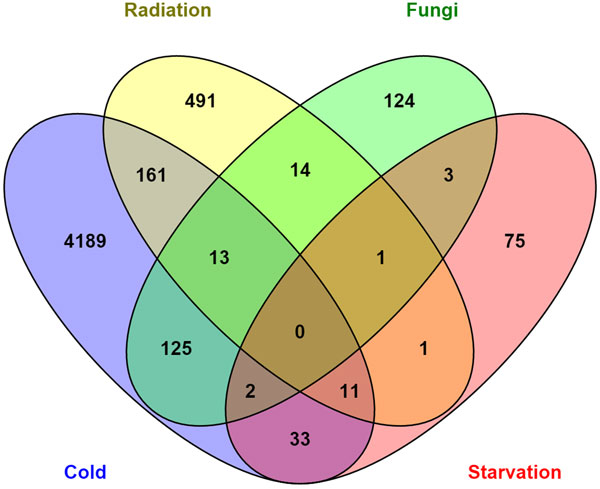
Figure 5.

Diagram representing the quantity of shared genes between the different treatments.
