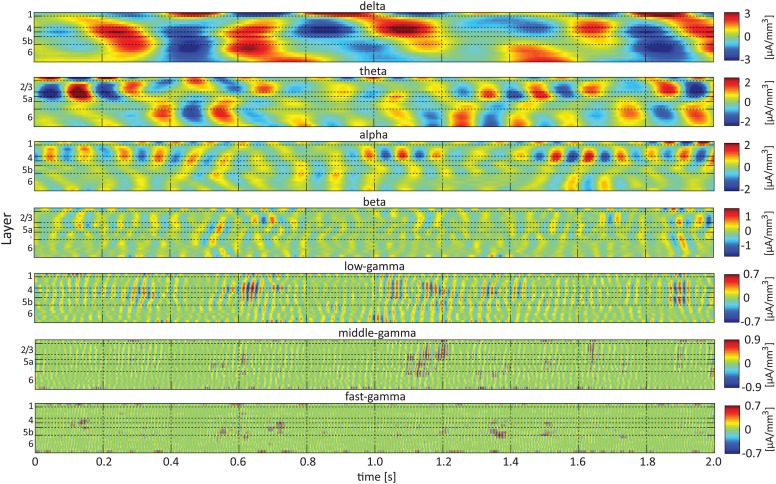
Figure 3.
Band-limited spontaneous current-source density. The 7 panels show spontaneous current source density in the delta (top), theta, alpha, beta, low-gamma, middle-gamma, and high-gamma (bottom) bands. The color look-up table was scaled linearly according to the maximal absolute value, separately for each band.

