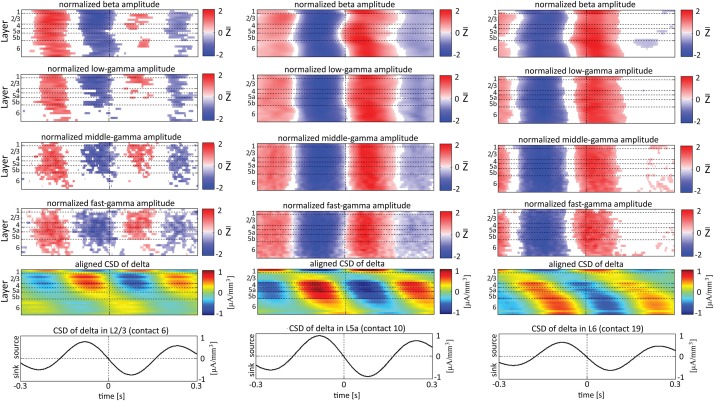
Figure 8.
Alignment of amplitudes with the CSD of the delta oscillations obtained from 3 specific contacts. In the left-most columns, the amplitudes of higher rhythms (from beta to fast-gamma, top 4 panels) in each contact were aligned with the CSD of the delta rhythm from layer 2/3 (contact 6). The reference signal, the CSD in the delta band from contact 6, is shown at the bottom. The 2nd panel from the bottom presents the average of the CSD in the delta band aligned with the CSD of the same rhythm from contact 6. White entries in the panels that present amplitudes represent values that were not different than zero (n = 12 data-sets; two-tailed t-test corrected for FDR, q < 0.01). In the middle columns, the amplitudes of higher rhythms were aligned with the CSD of the delta rhythm from layer 5a (contact 10). In the right-most columns, the amplitudes of higher rhythms were aligned with the CSD of the delta rhythm from layer 6 (contact 19).

