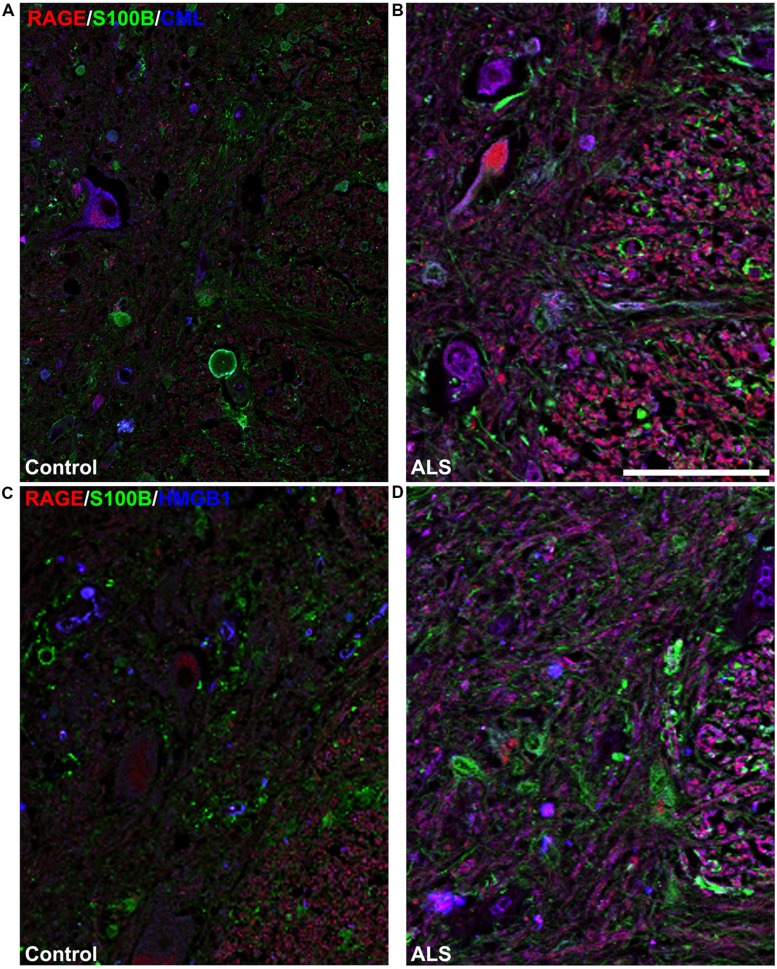
FIGURE 5.
High magnification images of white/gray matter showing triple staining for RAGE and its ligands S100B, CML, and HMGB1. Immunostaining for RAGE (red) and its ligands S100B (green) and CML or HMGB1 (blue) revealed low immunoexpression in control tissue (A and C) and high immunoexpression in ALS tissue (B and D). Sections are representative of n = 6 control and n = 5 ALS tissue samples per condition. Scale bar: 100 μm.

