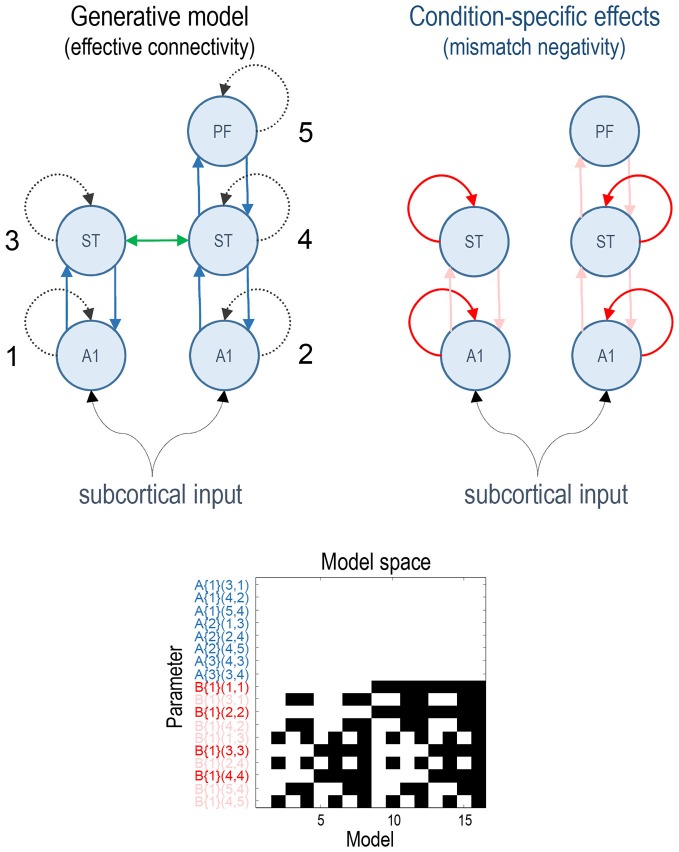
Figure 1.
This figure shows the basic model or network of five (equivalent current dipole) sources used to explain the ERP data. These constitute primary auditory (A1) sources, higher superior temporal (ST) and prefrontal (PF) sources (on the right). The interesting parameters of this model are the intrinsic and extrinsic coupling or effective connectivity parameters corresponding to the dashed and solid lines, respectively. These are the (random effects) model parameters and are divided into connections that are common to both conditions (A parameters in blue) and those that show condition-specific (i.e., mismatch negativity) effects (B parameters, extrinsic modulatory connections in pink, intrinsic—in red). The green lateral connection between the ST sources was only included in the ERP model. The lower panel shows the model space using a matrix of indicator variables, where white indicates a parameter that is enabled. These variables indicate which parameters constitute each of the 16 models considered, where the parameters are listed as connections among numbered sources (included in the upper right panel). The 16 models correspond to all combinations of models with and without changes in: intrinsic sensory (A1), intrinsic higher (ST), forward and backward connectivity.

