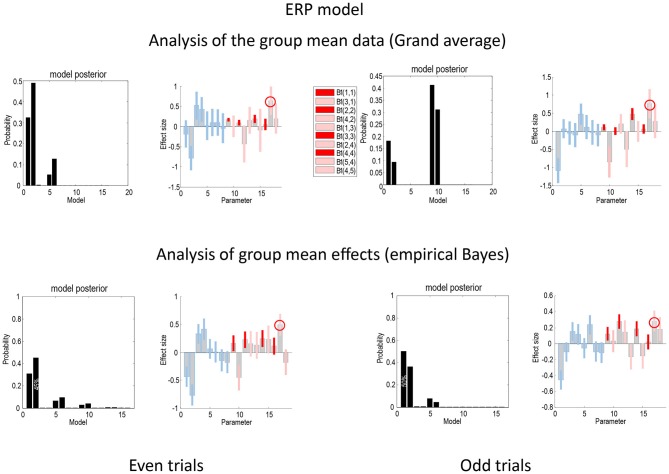
Figure 4.
This figure compares the Bayesian model comparison and averaging results obtained following an analysis of the grand average and empirical Bayesian analysis of the group data, for even (left) and odd (right) trials, using the ERP model. The key thing to note here is that the profile of model evidences is more consistent following empirical Bayesian inversion; suggesting that models with increases in intrinsic sensory and forward connectivity have the highest evidence. Furthermore, the Bayesian model averages are consistent between the odd and even analyses—and with the analysis of the grand mean. The gray bars correspond to posterior estimates, while the colored bars represent 90% Bayesian confidence intervals: average (A parameters) connections are shown in blue, while connectivity changes (B parameters) are shown in red for intrinsic connections and pink for extrinsic connections. In all four analyses, the largest effect is seen in the forward connection to the prefrontal source (circled). With the exception of two connections in both analyses, the posterior densities over individual connections are internally consistent between odd and even trials.

