
Figure 6.
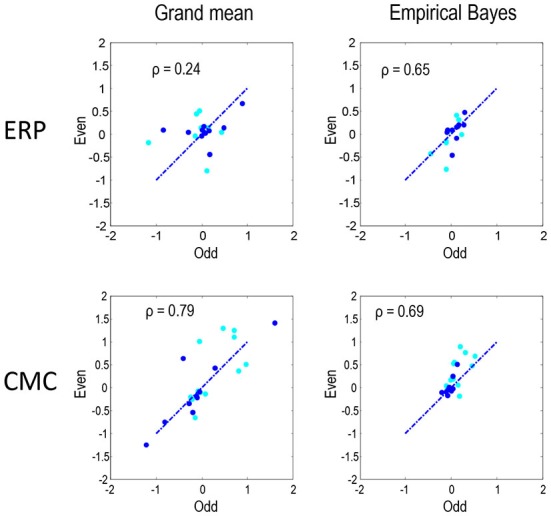
To quantify the reproducibility of MAP estimates of connectivity shown in Figures 4, 5 these estimates are compared directly as in Figure 3. Each plot shows the reproducibility of MAP estimates for the odd and even partition under a particular neural model and inversion procedure combination. The dark blue dots correspond to the condition-specific effects (B parameters), while the cyan dots report the common connections (A parameters). Pearson correlation coefficients were computed by pooling both sets of parameters.