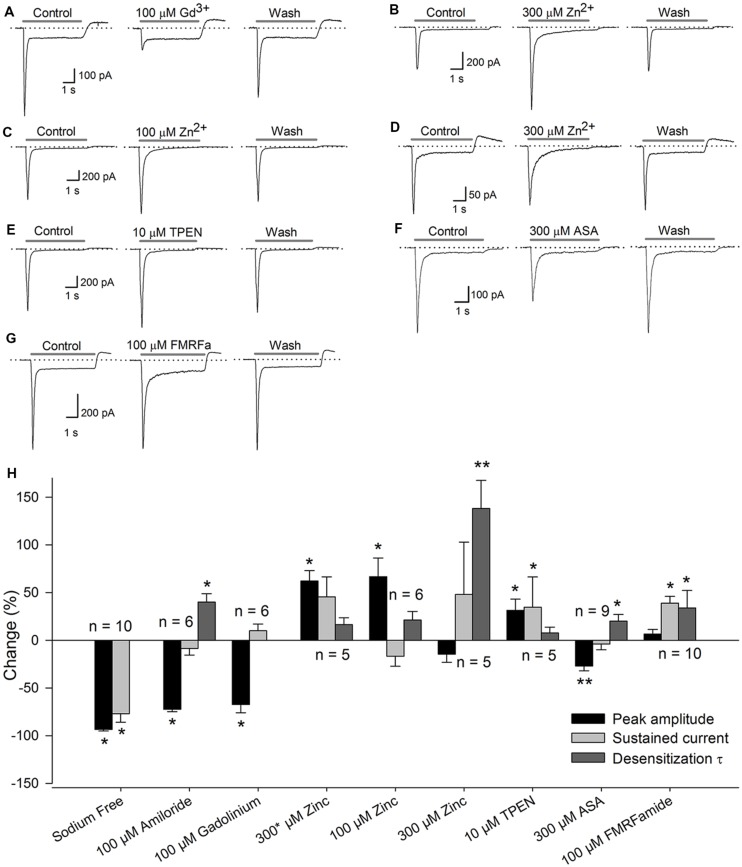
FIGURE 2.
Pharmacology of the ASICs in SGNs. Recordings of the ASIC current activated by a pH 6.1 solution (gray bar) under control conditions, after drug application, or after drug washout. The dotted line represents zero current. (A) coapplication of 100 μM Gd3+ reduced the Ipeak. (B) Coapplication of 300 μM Zn2+ (∗) increased the Ipeak. (C) Sustained application of 100 μM Zn2+ also increased the Ipeak. (D) sustained application of 300 μM Zn2+ increased the τdes. (E) Coapplication of 10 μM TPEN increased the Ipeak. (F) Sustained application of 300 μM ASA significantly decreased the Ipeak and increased the τdes. (G) Preapplication of 100 μM FMRFamide reversibly increased the τdes and the Isus. (H) Bar graph summarizing the effects of the drugs used (A–G) The bars represent the means ± SE of the Ipeak (black bars), the Isus (light gray bars) or the τdes (dark gray bars). The data are expressed as the percent-change relative to the control value. (∗P < 0.05, ∗∗P < 0.01, paired Student’s t-test).

