FIGURE 8.
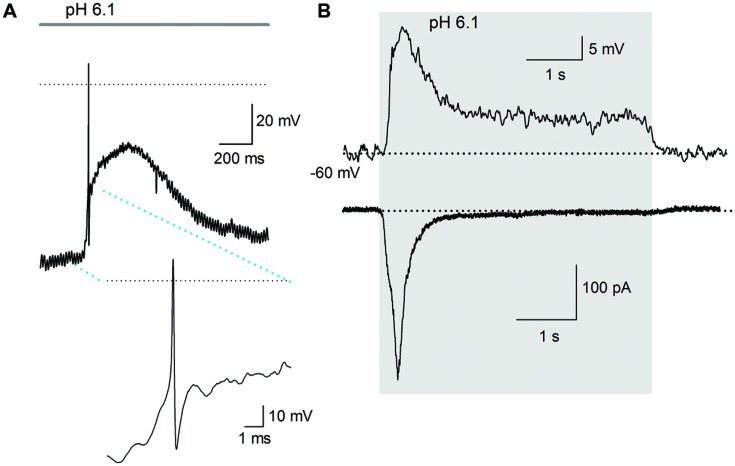
Action potential discharges are activated by acidic solution. (A) An AP evoked in response to a pH 6.1 solution; inset shows the AP in larger scale. Only one AP discharge occurred, followed by a large depolarization of about 40 mV. The dotted line represents zero voltage, and line at the top indicates the duration of acidic extracellular perfusion. The membrane potential was set at about -90 mV. (B) Current and voltage clamp recording from a cell. Above the current clamp recording shows that acid perfusion (from pH 7.4–6.1 -grey area), evoked no AP discharge although a slowly raising depolarization of >20 mV was induced in response to a pH 6.1 solution perfusion. The time course of the depolarization and its decay neatly follows the time course of the inward current (below) caused by the acidic solution. The dotted line indicates -60 mV for current clamp and 0 pA for voltage clamp recording.

