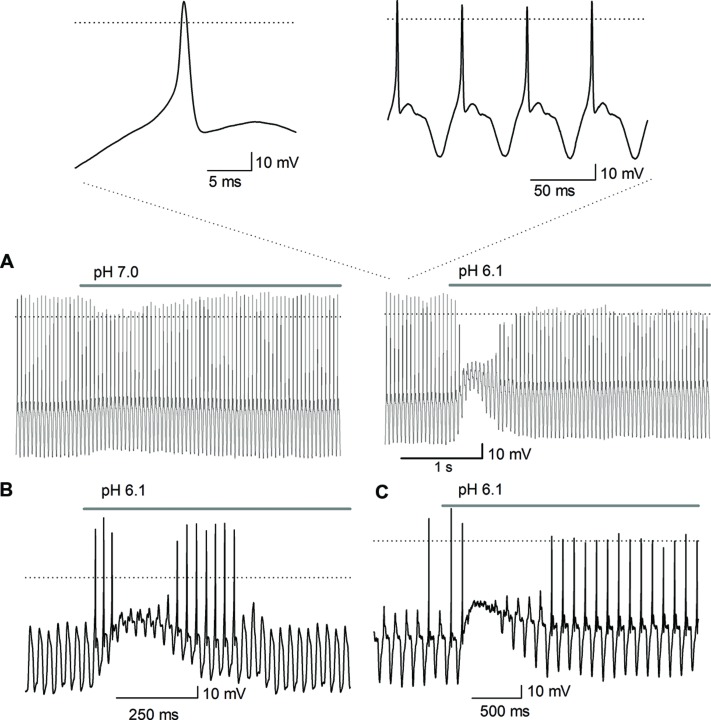
FIGURE 9.
Effect of acidic pH perfusion on the AP response to sinusoidal stimulation. The AP discharge was evoked by sinusoidal current injection (20 Hz). (A) The depolarization produced by pH 7.0 perfusion reduced the AP amplitude (left trace); pH 6.1 transiently blocked the AP discharge (right trace). The bar above traces indicates perfusion of the acidic solution, either pH 6.1 or pH 7.0. The acidic solution produced a depolarization (about 10 mV for pH 7.0 and of >20 mV for pH 6.1), inhibiting the AP discharge after the beginning of the acidic solution application in a pH-dependent form. The insets above shows the AP in an expanded scale which demonstrate they display a typical AP morphology, with a rapid depolarizing phase, upstroke above 0 mV and repolarization followed by a hyperpolarization period. The AP discharge is phase locked to the sinusoidal stimulation one-cycle to one-AP. (B,C) The sinusoidal stimulation was set just below threshold to generate AP. (B) The acid perfusion produced a brief burst of AP followed by inhibition of AP discharge during the largest depolarization (accompanied by a significant decrease of input resistance which produced the decay of membrane response to sinusoidal stimuli), and then again a brief burst of APs. (C) The acid perfusion produced a brief burst followed by inhibition of AP discharge during the maximal depolarization and followed by sustained discharge during the whole-acid pulse.

