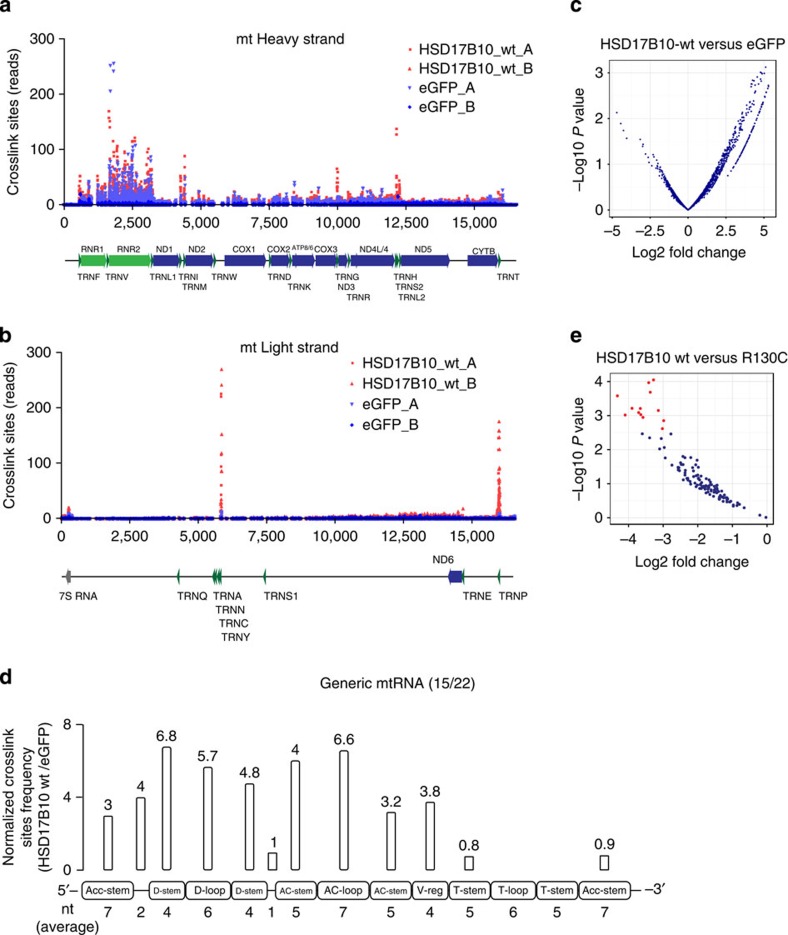
Figure 4. HSD17B10 iCLIP.
(a,b) Raw crosslink sites reads from for HSD17B10 wt and eGFP plotted on heavy and light mt strand, respectively. (c) Enrichment plot for differential crosslink sites on mt RNAs for HSD17B10 wt compared with eGFP. (d) Average fold enrichments for the HSD17B10/eGFP of the crosslink sites plotted on generic tRNA bound by HSD17B10 (15/22), normalized by the region length. (e) Enrichment plot for differential crosslink clusters on mt RNAs for HSD17B10 wt compared with the R130C disease variant.

