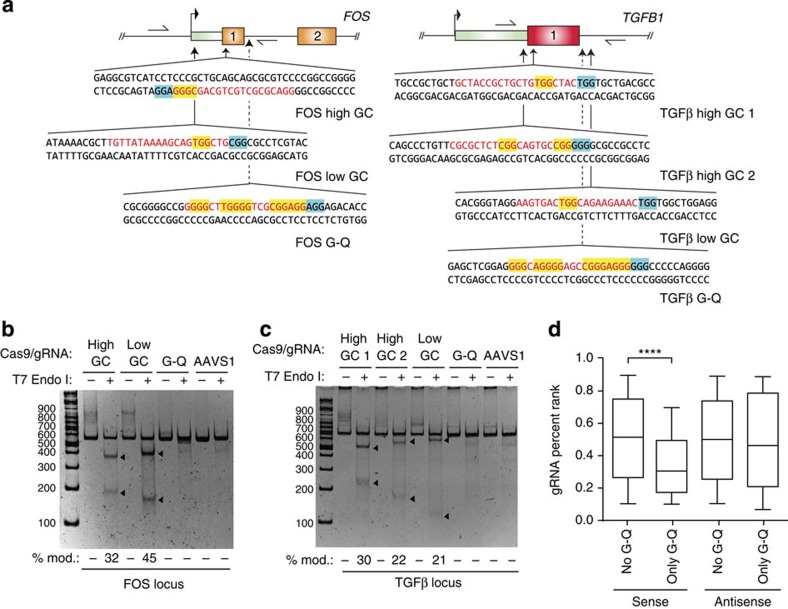
Figure 2. Endogenous PAM-rich/G-Q motif sites are refractory to Cas9-driven editing.
(a) Schematic representation of the location for each target site sequence in their genic context for FOS and TGFB1 loci. The sequences of the target sites are shown. Red text indicates the gRNA complementary target site sequence, blue highlights the targeted PAM, and yellow highlights NGG motifs within the body of the target site (flanking non-targeted DNA sequences is written in black text). Primer binding sites for PCR amplification prior to performing the T7endI assay are marked as lines with half-arrowheads. (b,c) Genomic modification by Cas9 at PAM-rich G-Q local sites is strongly inhibited relative to nearby PAM poor low or high GC-content target sites as measured by a T7endI assay. Shown are representative experiments with the digested fragments, denoted by triangles, representing the fraction of the targeted genomic region by Cas9 that had been repaired by NHEJ. The 100 bp increments of the DNA ladder are shown to the left of the blot. Underneath each lane the % modification is indicated. (d) Sequences with G-Q motifs on the sense strand are disfavoured by CRISPR-Cas9 for editing. Box-and-whisker plots of the reported gRNA percent ranks separating sequences into those that exclude or include predicted G-Q motifs, for either sense or antisense gRNA targeting site sequences. The top, middle and bottom lines of the ‘box' represent the 25th, 50th and 75th percentiles, respectively, while the ‘whiskers' represent the 10th and 90th percentiles. ****, P value ≤0.0001 as determined by the Kolmogorov–Smirnov test.

