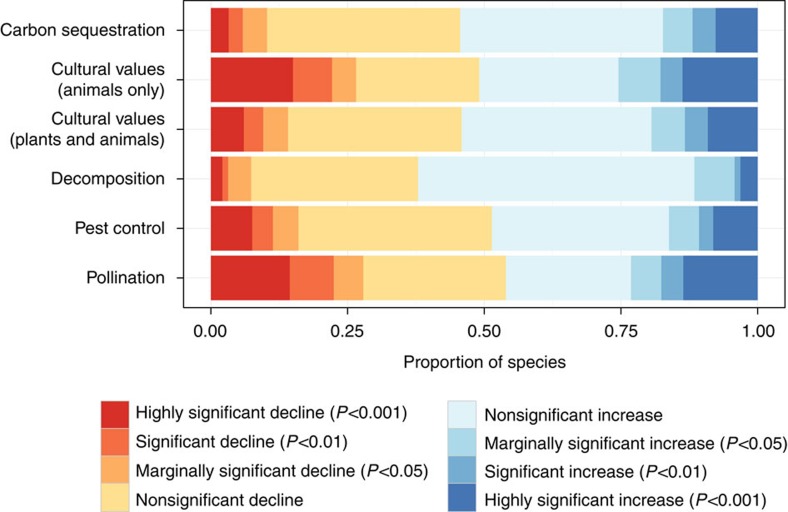
Figure 1. Trends in species grouped by ecosystem function.
Shown are the proportion of species in different functional groupings showing significant changes in frequency of occurrence in Great Britain between 1970 and 2010. Total sample sizes for respective rows are as follows: n=2,276; 590; 2,615; 95; 1,447; 720.

