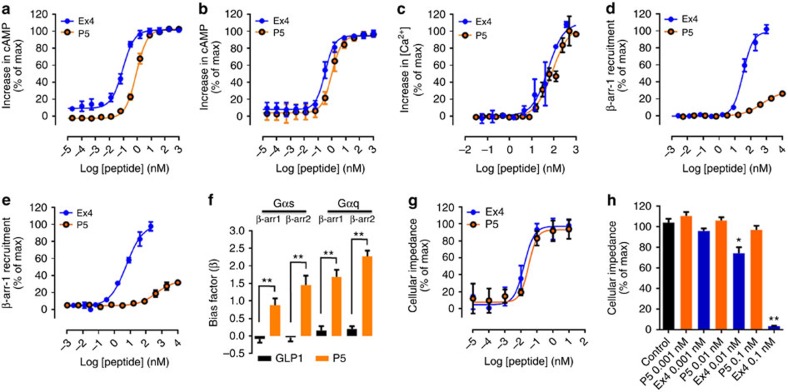
Figure 2. In vitro pharmacological characterization of P5 (ELVDNAVGGDLSKQMEEEAVRLFIEWLKNGGPSSGAPPPS).
(a,b) Concentration–response curves for P5- and Ex4-induced increase in cAMP production in CHO cells expressing the human GLP-1R (a) or in HEK293 cells expressing the mouse GLP-1R (b). (c) Concentration–response curves for P5, and Ex4-induced calcium mobilization in CHO cells expressing the human GLP-1R. (d,e) Concentration–response curves for P5, and Ex4-induced β-arrestin 1 (d) and β-arrestin 2 (e) recruitment in CHO cells expressing the human GLP-1R. (f) Biased factors (β) from an equiactive comparison indicate bias for P5. (g) Concentration–response curves for P5- and Ex4-induced changes in cellular impedance in CHO cells expressing the human GLP-1R. (h) Concentration-dependent effects of P5 and Ex4 toward GLP-1R desensitization (n=3). The data are mean±s.e.m. of a typical experiment that was performed independently at least three times. Statistic by two-tailed t-test: *P<0.05; **P<0.01.

