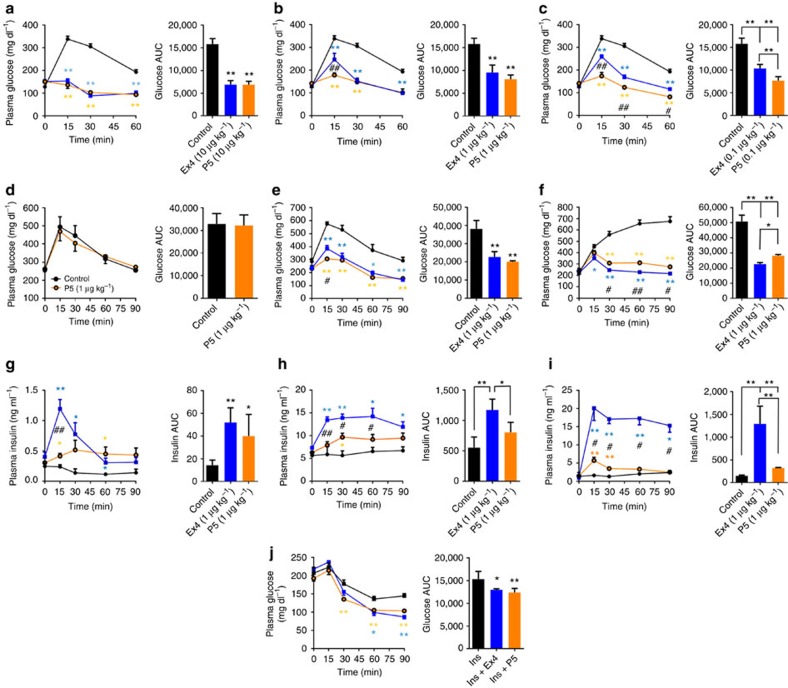
Figure 3. Acute administration of P5 lowers glucose in diabetic mice.
Effect on intraperitoneal glucose tolerance after a single intraperitoneal co-injection of saline (black), Ex4 (blue) or P5 (orange) with glucose challenge (n=5). Glucose tolerance in lean mice treated with 10 μg kg−1 (a), 1 μg kg−1 (b) or 0.1 μg kg−1 (c), in GLP-1RKO treated with 1 μg kg−1 (d), in ob/ob mice treated with 1 μg kg−1 (e) and in DIO mice treated with 1 μg kg−1 (f). (g–i) Effect of P5 on plasma insulin levels. Plasma analysis was performed after a single intraperitoneal co-injection of saline (black), 1 μg kg−1 of Ex4 (blue) or 1 μg kg−1 of P5 (orange) with glucose challenge (n=5) in lean mice (g), in ob/ob mice (h) and in DIO mice (i). (j) Blood glucose levels measured in ob/ob mice after a single intraperitoneal co-injection of saline (black), Ex4 (blue) or P5 (orange) with insulin (n=5).Data are mean±s.e.m. Statistic by two-tailed t-test: *P<0.05; **P<0.01, comparing saline to peptide injection; #P<0.05; ##P<0.01, comparing Ex4 to P5 injection. AUC, area under the curve.

