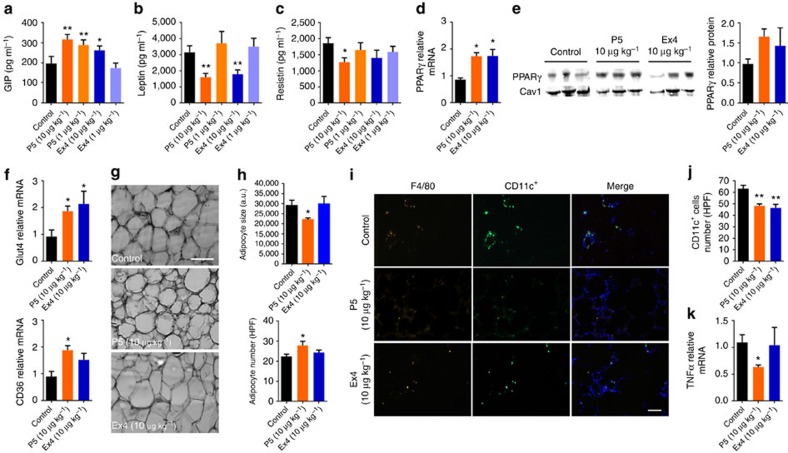
Figure 5. Chronic administration of the G-protein-biased agonist modulates adipogenesis and insulin sensitivity in DIO mice.
Effect of P5 or Ex4 on GIP (a), leptin (b) and resistin (c) plasma levels following daily subcutaneous injections of saline (control), Ex4 or P5 (n=6). (d) Real-time quantitative PCR (qPCR) analysis on the expression of the gene encoding PPARγ (n=6) and (e) western blot analysis of PPARγ protein expression in epididymal white adipose tissue (eWAT) following daily subcutaneous injections of saline (control), Ex4 or P5. Caveolin-1 (Cav1) was used as loading control. (f) qPCR analysis of eWAT mRNA expression of genes regulated by PPARγ activity Glut4 and CD36 following daily subcutaneous injections of saline (control), Ex4 or P5 (n=6). (g) Representative microscopy images of eWAT from DIO mice following daily subcutaneous injections of saline (control), Ex4 or P5. Sections were stained using hematoxylin and eosin (n=4). Scale bar, 100 μm. (h) Adipocyte cell size and number per high-powered field (HPF) in DIO mice following daily subcutaneous injections of saline (control), Ex4 or P5. (i) Representative immunofluorescence microscopy images of eWAT co-stained with F4/80 and CD11c. Scale bar, 50 μm. (j) Quantification of F4/80+ CD11c+ cells per high-powered field (HPF) in DIO mice following daily subcutaneous injections of saline (control), Ex4 or P5 (n=4). (k) qPCR analysis of eWAT mRNA expression of tumour-necrosis factor-α in DIO mice following daily subcutaneous injections of saline (control), Ex4 or P5 (n=6). Data are mean±s.e.m. Statistic by two-tailed t-test: *P<0.05; **P<0.01, comparing saline to peptide injection.

